

Regulation of MDMX expression by mitogenic signaling
- PMID: 18172009
- PMCID: PMC2268405
- DOI: 10.1128/MCB.01633-07
Regulation of MDMX expression by mitogenic signaling
Abstract
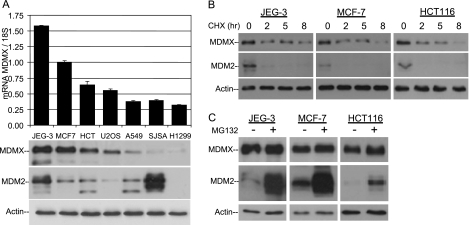
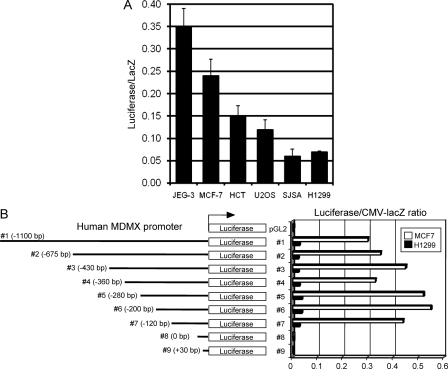
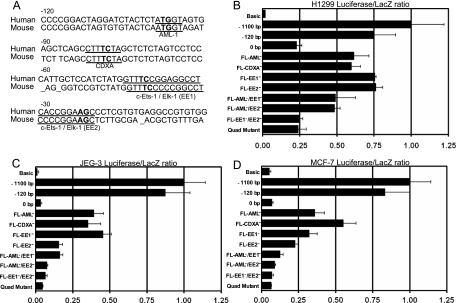
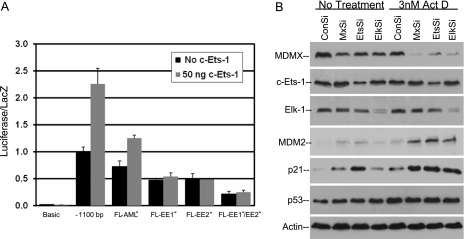
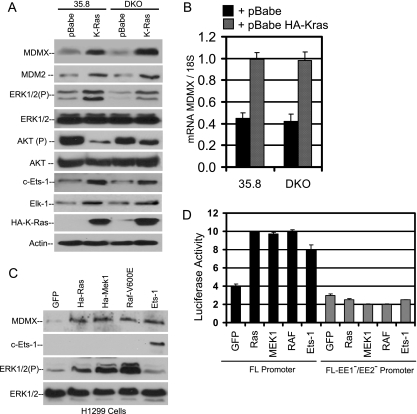
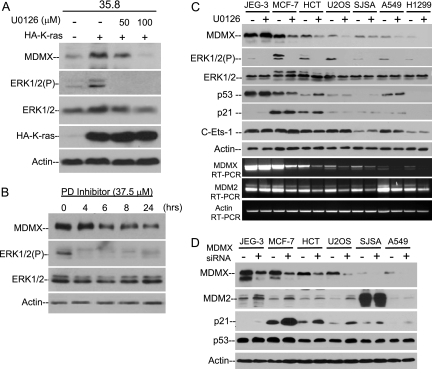
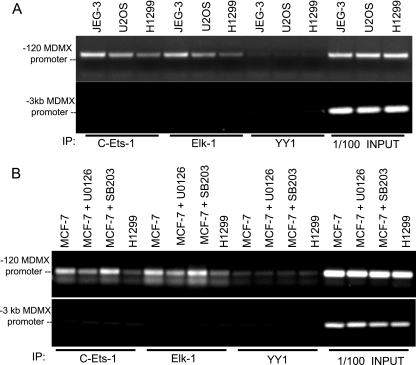
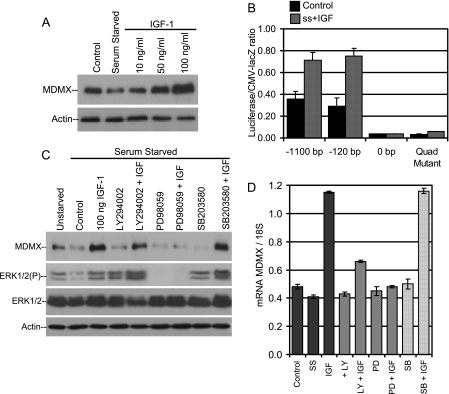
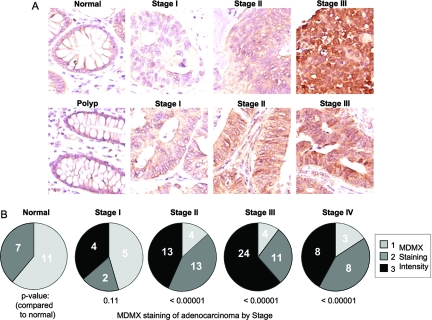
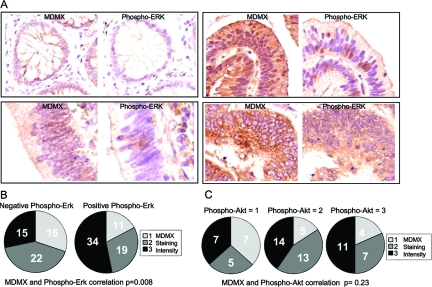
MDMX is an important regulator of p53 transcriptional activity and stress response. MDMX overexpression and gene amplification are implicated in p53 inactivation and tumor development. Unlike MDM2, MDMX is not inducible by p53, and little is known about its regulation at the transcriptional level. We found that MDMX levels in tumor cell lines closely correlate with promoter activity and mRNA level. Activated K-Ras and insulin-like growth factor 1 induce MDMX expression at the transcriptional level through mechanisms that involve the mitogen-activated protein kinase and c-Ets-1 transcription factors. Pharmacological inhibition of MEK results in down-regulation of MDMX in tumor cell lines. MDMX overexpression was detected in approximately 50% of human colon tumors and showed strong correlation with increased extracellular signal-regulated kinase phosphorylation. Therefore, MDMX expression is regulated by mitogenic signaling pathways. This mechanism may protect normal proliferating cells from p53 but also hamper p53 response during tumor development.
Figures
Similar articles
-
p53-independent activation of the hdm2-P2 promoter through multiple transcription factor response elements results in elevated hdm2 expression in estrogen receptor alpha-positive breast cancer cells.Cancer Res. 2003 May 15;63(10):2616-23. Cancer Res. 2003. PMID: 12750288
-
Overexpression of Mdm2 and MdmX fusion proteins alters p53 mediated transactivation, ubiquitination, and degradation.Biochemistry. 2003 Mar 4;42(8):2291-9. doi: 10.1021/bi0271291. Biochemistry. 2003. PMID: 12600196
-
Elevated MDM2 boosts the apoptotic activity of p53-MDM2 binding inhibitors by facilitating MDMX degradation.Cell Cycle. 2008 Jun 1;7(11):1604-12. doi: 10.4161/cc.7.11.5929. Epub 2008 Mar 17. Cell Cycle. 2008. PMID: 18520179
-
Regulation of p53: a collaboration between Mdm2 and Mdmx.Oncotarget. 2012 Mar;3(3):228-35. doi: 10.18632/oncotarget.443. Oncotarget. 2012. PMID: 22410433 Free PMC article. Review.
-
Mdmx and Mdm2: brothers in arms?Cell Cycle. 2004 Jul;3(7):900-4. Epub 2004 Jul 2. Cell Cycle. 2004. PMID: 15254433 Review.
Cited by
-
Human epidermal growth factor receptor 4 (Her4) Suppresses p53 Protein via Targeting the MDMX-MDM2 Protein Complex: IMPLICATION OF A NOVEL MDMX SER-314 PHOSPHOSITE.J Biol Chem. 2016 Dec 9;291(50):25937-25949. doi: 10.1074/jbc.M116.752303. Epub 2016 Oct 24. J Biol Chem. 2016. PMID: 27777309 Free PMC article.
-
MDM2 and MDMX: Alone and together in regulation of p53.Transl Cancer Res. 2012 Aug;1(2):88-89. Transl Cancer Res. 2012. PMID: 23002429 Free PMC article.
-
Estrogen receptor alpha (ERα/ESR1) mediates the p53-independent overexpression of MDM4/MDMX and MDM2 in human breast cancer.Oncotarget. 2016 Mar 29;7(13):16049-69. doi: 10.18632/oncotarget.7533. Oncotarget. 2016. PMID: 26909605 Free PMC article.
-
MDMX in Cancer: A Partner of p53 and a p53-Independent Effector.Biologics. 2024 Jan 31;18:61-78. doi: 10.2147/BTT.S436629. eCollection 2024. Biologics. 2024. PMID: 38318098 Free PMC article. Review.
-
MDM4 expression as an indicator of TP53 reactivation by combined targeting of MDM2 and MDM4 in cancer cells without TP53 mutation.Oncoscience. 2014 Nov 25;1(12):830-43. doi: 10.18632/oncoscience.103. eCollection 2014. Oncoscience. 2014. PMID: 25621298 Free PMC article.
References
-
- Agarwal, M. L., C. V. Ramana, M. Hamilton, W. R. Taylor, S. E. DePrimo, L. J. Bean, A. Agarwal, M. K. Agarwal, A. Wolfman, and G. R. Stark. 2001. Regulation of p53 expression by the RAS-MAP kinase pathway. Oncogene 202527-2536. - PubMed
-
- Banin, S., L. Moyal, S. Shieh, Y. Taya, C. W. Anderson, L. Chessa, N. I. Smorodinsky, C. Prives, Y. Reiss, Y. Shiloh, and Y. Ziv. 1998. Enhanced phosphorylation of p53 by ATM in response to DNA damage. Science 2811674-1677. - PubMed
-
- Bond, G. L., W. Hu, E. E. Bond, H. Robins, S. G. Lutzker, N. C. Arva, J. Bargonetti, F. Bartel, H. Taubert, P. Wuerl, K. Onel, L. Yip, S. J. Hwang, L. C. Strong, G. Lozano, and A. J. Levine. 2004. A single nucleotide polymorphism in the MDM2 promoter attenuates the p53 tumor suppressor pathway and accelerates tumor formation in humans. Cell 119591-602. - PubMed
Publication types
MeSH terms
Substances
Grants and funding
LinkOut - more resources
Full Text Sources
Research Materials
Miscellaneous