. 2008 Jan 8;105(1):305-10.
doi: 10.1073/pnas.0710780104. Epub 2008 Jan 2.

A combined transcriptome and proteome survey of malaria parasite liver stages

Affiliations

A combined transcriptome and proteome survey of malaria parasite liver stages

Alice S Tarun et al. Proc Natl Acad Sci U S A. .

Abstract

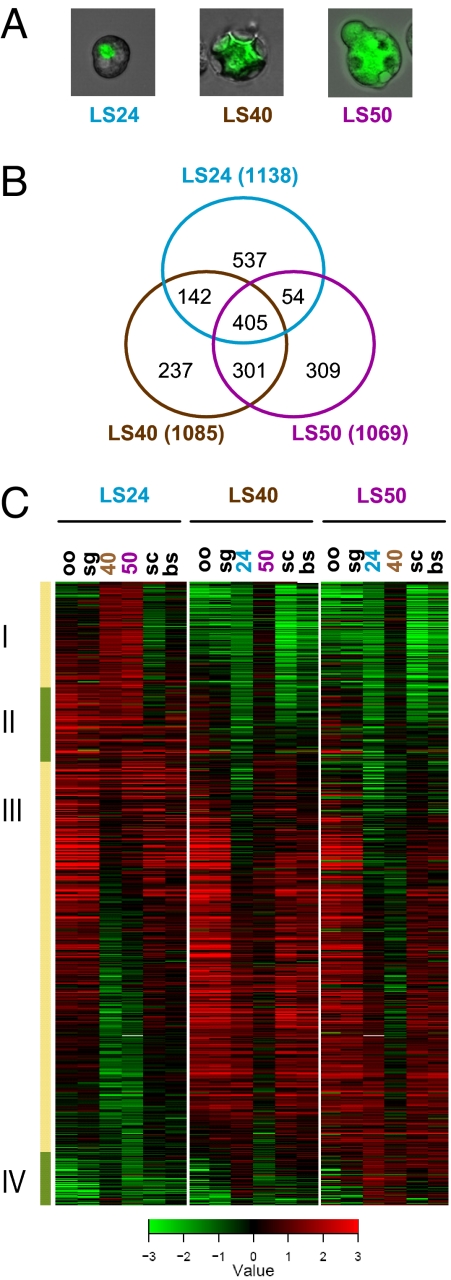
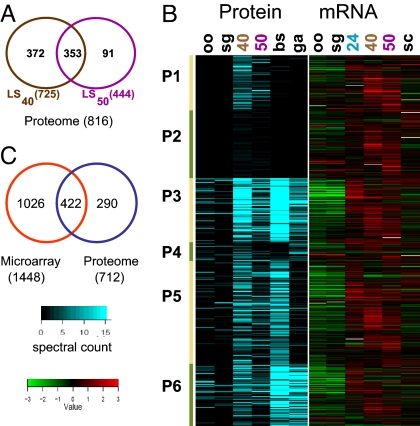
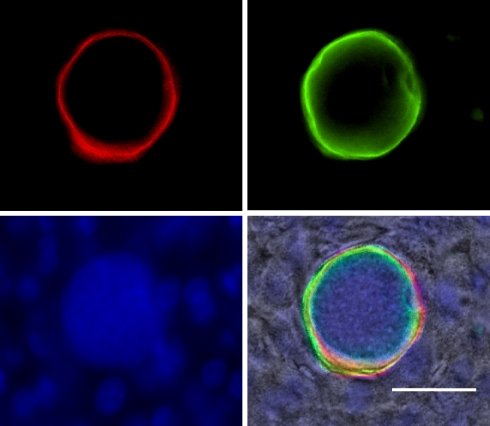
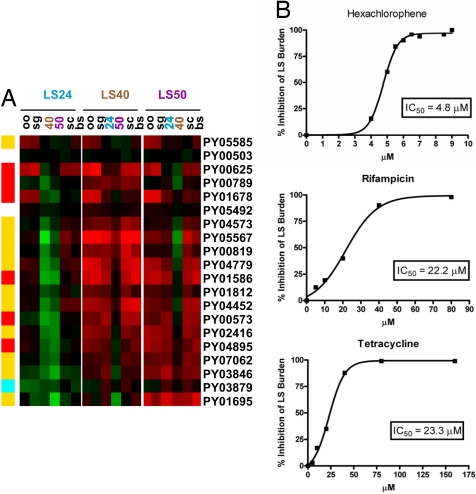
For 50 years since their discovery, the malaria parasite liver stages (LS) have been difficult to analyze, impeding their utilization as a critical target for antiinfection vaccines and drugs. We have undertaken a comprehensive transcriptome analysis in combination with a proteomic survey of LS. Green fluorescent protein-tagged Plasmodium yoelii (PyGFP) was used to efficiently isolate LS-infected hepatocytes from the rodent host. Genome-wide LS gene expression was profiled and compared with other parasite life cycle stages. The analysis revealed approximately 2,000 genes active during LS development, and proteomic analysis identified 816 proteins. A subset of proteins appeared to be expressed in LS only. The data revealed exported parasite proteins and LS metabolic pathways including expression of FASII pathway enzymes. The FASII inhibitor hexachlorophene and the antibiotics, tetracycline and rifampicin, that target the apicoplast inhibited LS development, identifying FASII and other pathways localized in the apicoplast as potential drug targets to prevent malaria infection.


Conflict of interest statement

Conflict of interest statement: S.H.I.K. is a coinventor on two patent applications relevant to this work (Genetically attenuated malaria vaccines, patent no. WO 2005/063991; and Plasmodium liver stage antigens, patent no. WO 2007/041216). The patents were filed for patent protection to promote the development and distribution of malaria vaccines to people in need worldwide, in accordance with a global access strategy.

Figures

Fig. 1.
Fig. 1.
Comprehensive transcriptional profile of LS active genes. (A) Closeup images of LS-infected hepatocytes for each time point are shown. (B) Venn diagram of the overlap of LS active genes detected from LS24, LS40, and LS50. (C) Gene expression profiles of LS active genes show four clusters of peak expression. The heat map shows the expression ratios of each LS sample compared with all of the other life stages: oo, oocyst sporozoite; sg, salivary gland sporozoite; 24, LS24; 40, LS40; 50, LS50; bs, mixed blood stages; and sc, blood-stage schizonts. Green indicates down-regulation, whereas red indicates up-regulation of the gene in the LS sample compared with the other stages.
Fig. 2.
Fig. 2.
Correlation between LS gene and protein expression. (A) Venn diagram of the overlap between LS40- and LS50-detected proteins. (B) LS-detected proteins are grouped into six clusters based on their detection patterns in other stages (10) as explained in the text: oo, P. berghei oocyst sporozoite; sg, P. berghei salivary gland sporozoite; 40, LS40; 50, LS50; bs, P. berghei asexual blood stages; and ga, P. berghei gametocytes. Estimation of protein abundance is based on the total spectral counts for each protein from the tandem mass spectrometry data and is indicated by the intensity of the blue shading. The corresponding expression profile for the genes encoding the LS detected proteins is shown (Right). The heat map for the gene expression profile is expressed as the ratio of gene expression for each stage by using the mixed blood-stage sample as reference: oo, oocyst sporozoite; sg, salivary gland sporozoite; 24, LS24; 40, LS40; 50, LS50; and sc, blood-stage schizonts. Green indicates down-regulation, whereas red indicates up-regulation of the gene in the LS sample compared with the other stages. (C) Venn diagram of the overlap between P. yoelii LS schizont (LS40 + LS50) transcriptome and proteome.
Fig. 3.
Fig. 3.
PY04499 is an LS-specific protein localized to the parasitophorous vacuole (PV). Immunofluorescence assay was done by using tissue sections of 44-h pi infected mouse livers. The image shows a LS schizont stained with antisera against PY04499 (green) and a monoclonal antibody against Hep17 (red). The antisera against PY04499 were generated in rabbits by using the “KYLLLHHTNAFL” peptide. Hepatocyte and parasite nuclei were visualized with DAPI (blue). (Scale bar, 50 μm.)
Fig. 4.
Fig. 4.
The fatty acid synthesis pathway in LS and drug inhibition studies. (A) Gene and protein expression involved in fatty acid synthesis, including the FASII pathway, is highly induced in LS. The heat map shows the expression ratios of each LS sample compared with all of the other life stages: oo, oocyst sporozoite; sg, salivary gland sporozoite; 24, LS24; 40, LS40; 50, LS50; bs, mixed blood stages; and sc, blood-stage schizonts. Green indicates down-regulation, whereas red indicates up-regulation of the gene in the LS sample compared with the other stages. The summary of gene and protein expression of proteins and enzymes in the fatty acid synthesis pathway is shown (Left): yellow indicates the gene is in the LS transcriptome, and the protein is detected in the LS proteome; red indicates gene is in the LS transcriptome; blue indicates protein is in the LS proteome; and white indicates no detection in either LS transcriptome or LS proteome. (B) Dose–response curves for the FASII inhibitor hexachlorophene and the antibacterials, rifampicin and tetracycline, for the inhibition of P. yoelii LS development in hepatoma cells measured at 40 h pi. Each drug inhibits LS growth efficiently.

Similar articles

Cited by

References

    1. Snow RW, Guerra CA, Noor AM, Myint HY, Hay SI. The global distribution of clinical episodes of Plasmodium falciparum malaria. Nature. 2005;434:214–217. - PMC - PubMed
    1. Greenwood B. Malaria vaccines Evaluation and implementation. Acta Trop. 2005;95:298–304. - PubMed
    1. Miller LH, Baruch DI, Marsh K, Doumbo OK. The pathogenic basis of malaria. Nature. 2002;415:673–679. - PubMed
    1. Hoffman SL, Doolan DL. Malaria vaccines targeting infected hepatocytes. Nat Med. 2000;6:1218–1219. - PubMed
    1. Alonso PL, et al. Duration of protection with RTS,S/AS02A malaria vaccine in prevention of Plasmodium falciparum disease in Mozambican children: Single-blind extended follow-up of a randomised controlled trial. Lancet. 2005;366:2012–2018. - PubMed

Publication types

Associated data