. 2008 Jan 8;105(1):347-52.
doi: 10.1073/pnas.0707197105. Epub 2008 Jan 2.

Photolysis of a caged peptide reveals rapid action of N-ethylmaleimide sensitive factor before neurotransmitter release

Affiliations

Photolysis of a caged peptide reveals rapid action of N-ethylmaleimide sensitive factor before neurotransmitter release

T Kuner et al. Proc Natl Acad Sci U S A. .

Abstract

The time at which the N-ethylmaleimide-sensitive factor (NSF) acts during synaptic vesicle (SV) trafficking was identified by time-controlled perturbation of NSF function with a photoactivatable inhibitory peptide. Photolysis of this caged peptide in the squid giant presynaptic terminal caused an abrupt (0.2 s) slowing of the kinetics of the postsynaptic current (PSC) and a more gradual (2-3 s) reduction in PSC amplitude. Based on the rapid rate of these inhibitory effects relative to the speed of SV recycling, we conclude that NSF functions in reactions that immediately precede neurotransmitter release. Our results indicate the locus of SNARE protein recycling in presynaptic terminals and reveal NSF as a potential target for rapid regulation of transmitter release.


Conflict of interest statement

The authors declare no conflict of interest.

Figures

Fig. 1.
Fig. 1.
Models of NSF function. (A) NSF acting upstream of neurotransmitter release. Colors indicate NSF (yellow), αSNAP (green), v-SNARE (blue), and t-SNAREs (orange). (B) Model showing a postfusion role of NSF. (C) Because the SV cycle requires 45–90 s (Left), a prefusion block of NSF action would occur much more quickly (Center), whereas a postfusion block would require all or most of the 45–90 s (Right).
Fig. 2.
Fig. 2.
Design of the cNSF3 peptide. (A) Sequence of the squid NSF3 peptide. Underlined residue is G309, the Comatose locus (corresponds to G274 in NSF-1 of Drosophila). The caged lysine residue K307 is in red and marked by *. (B) Schematic representation of NSF with structural elements contributing to the lateral surfaces of the N and D1 domains. (Upper) N, D1, and D2 denote the three domains of a NSF monomer; the schematic side view shows only three subunits of the hexamer. (Lower) Predicted structure of the N and D1 domains of NSF, based on coordinates taken from the NSF homologue P97 (71). The 2.5-nm-thick slab shows the N domain in orange, D1 domain in yellow, the NSF3 peptide in blue, and the caged lysine residue in red. Other active NSF peptides (28) are indicated in green (NSF1) and purple (NSF2). (C) Photochemistry of CMNCBZ-caged lysine. Absorption of a photon of UV light rapidly removes most of the cage, whereas a slower spontaneous decarboxylation removes the rest and generates free CO2 (34).
Fig. 3.
Fig. 3.
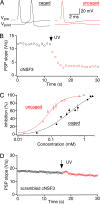
Photolysis of cNSF in the presynaptic terminal. (A) Inhibition of synaptic transmission after uncaging microinjected cNSF3 (0.75 mM) in the giant terminal of the squid. Action potentials were elicited every 1 s. Simultaneous presynaptic (Vpre) and postsynaptic (Vpost) voltage recordings immediately before (black) and after (red) uncaging (stimulation artifact blanked) are shown. (B) Rapid time course of inhibitory effects of uncaged NSF3. The slope of the PSP was determined from fits to the initial rise of the PSP and plotted as a function of time. UV light was applied for 50 ms (arrow, ≈150 mJ/mm2). The terminal was injected with 0.75 mM cNSF3. (C) Concentration-dependent inhibition of synaptic transmission by cNSF3 peptide (black closed circles, n = 14) and uncaged peptide (red open circles, n = 14). See SI Text for further details. (D) Lack of effect of photolysis of scrambled cNSF3 peptide (0.64 mM). UV light (750 mJ/mm2) was applied three times at the point indicated by the arrow.
Fig. 4.
Fig. 4.
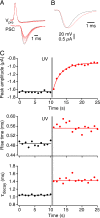
Differential onset of amplitude and kinetic effect. (A) Simultaneous presynaptic and postsynaptic recordings before (black line) and after (red line) photolysis of cNSF3 peptide. Synapse was stimulated at 1 Hz. (B) Scaled PSCs, from the experiment shown in A, before (black) and after (red) uncaging of NSF3. (C) Onset of changes in PSC amplitude (Top), PSC rise time (20–80%; Middle), and PSC decay time constant (Bottom). UV light (150 mJ/mm2) was applied at the 10-s time point (gray bar).
Fig. 5.
Fig. 5.
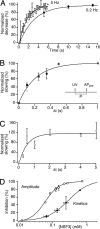
Activity dependency and onset of fast effect. (A) Time course of the slow effect of uncaged NSF3 on PSC amplitude. The fractional reduction of PSC amplitude is plotted as a function of time after peptide photolysis. Continuous curves are exponential functions with time constants of 1.6 s (5 Hz) and 3.1 s (0.2 Hz). Data points reflect 7 and 10 independent experiments, respectively. (B) Time course of the rapid effect of uncaged NSF3 on PSC kinetics. The fractional slowing of PSC decay time constant is plotted as a function of the time interval (Δt) between the UV light flash (UV) and the presynaptic stimulus (APpre). (Inset) The experimental protocol is illustrated. Data from eight independent experiments using two stimulus frequencies (0.2 Hz, circles; 1 Hz, triangles) were pooled (squares) because the two data sets did not differ. The continuous curve is an exponential function with a time constant of 0.22 s. (C) Time course of the rapid inhibition of PSC kinetics by uncaged NSF3 under conditions of minimal synaptic activity (0.03 Hz). The continuous curve is an exponential function with a time constant of 0.5 s. Each point is from two to five experiments. (D) Concentration-dependent inhibition of PSC amplitude (open circles, IC50 = 0.28 ± 0.02 mM) and decay kinetics (closed circles, IC50 = 0.06 ± 0.01 mM) by uncaged NSF3. Each point is from three to nine experiments.
Fig. 6.
Fig. 6.
Endocytosis unaffected by cNSF photolysis. Time course of endocytosis before (gray) and after (red) photolysis of cNSF3. Relative Cm change is shown as a range (mean ± SEM, gray and red zones for five independent experiments. Time of high-frequency stimulaton is shown by the gray bar; cNSF photolysis occurs immediately afterward, in the case of the trace shown in red.
Fig. 7.
Fig. 7.
Model of NSF function and life cycle of SNARE proteins. (A) Model for the dual actions of NSF in transmitter release. A complete cycle of SV trafficking requires 45–90 s (27). After vesicle docking (nos. 1–2 transition), the slow action of NSF primes SVs over a time scale of seconds. Readily releasable vesicles (no. 3; highlighted red) can then fuse in a calcium-dependent reaction that is influenced by NSF acting within a time window of <0.5 s. After membrane fusion, vesicles bud off from the plasma membrane (nos. 5–6 transition) and are then recycled (nos. 6–1 transition). (B) Postulated dynamics of SNARE proteins during exocytosis. (No. 1) SVs and plasma membrane contain cis-SNARE complexes, to which αSNAP and NSF bind (41). Plasma membrance cis-SNARE complexes are not shown for clarity. (No. 2) αSNAP and SNAREs stimulate the ATPase activity of NSF, causing disassembly of cis-SNARE complexes. NSF may remain bound on SV even after unbinding of αSNAP (17). (No. 3) Free SNARE proteins from trans-SNARE complexes. To promote sorting, ectopic SNARE proteins may bind to acceptor proteins. For clarity, only the accepter protein (e.g. Munc18) for vesicular t-SNARE proteins is shown (red). (No. 4) As a result of membrane fusion, ectopic SNARE protiens are sorted onto the correct compartment during the time that SV and plasma membranes are continuous. (No. 5) Cis-SNARE complexes are retrieved along with the SV membrane during endocytosis. (No. 6) Recycling SVs contain cis-SNARE complexes (44). NSF (yellow), αSNAP (green), v-SNARE (blue), t-SNARE (orange).

Similar articles

Cited by

References

    1. Augustine GJ, Burns ME, DeBello WM, Hilfiker S, Morgan JR, Schweizer FE, Tokumaru H, Umayahara K. J Physiol (London) 1999;520:33–41. - PMC - PubMed
    1. Rettig J, Neher E. Science. 2002;298:781–785. - PubMed
    1. Jahn R, Sudhof TC. Annu Rev Biochem. 1999;68:863–911. - PubMed
    1. Sudhof TC. Nature. 1995;375:645–653. - PubMed
    1. Rothman JE. Nature. 1994;372:55–63. - PubMed

Publication types