Review
. 2008;49(1):35-53.
doi: 10.1093/ilar.49.1.35.

Small animal imaging with magnetic resonance microscopy

Affiliations
Review

Small animal imaging with magnetic resonance microscopy

Bastiaan Driehuys et al. ILAR J. 2008.

Abstract

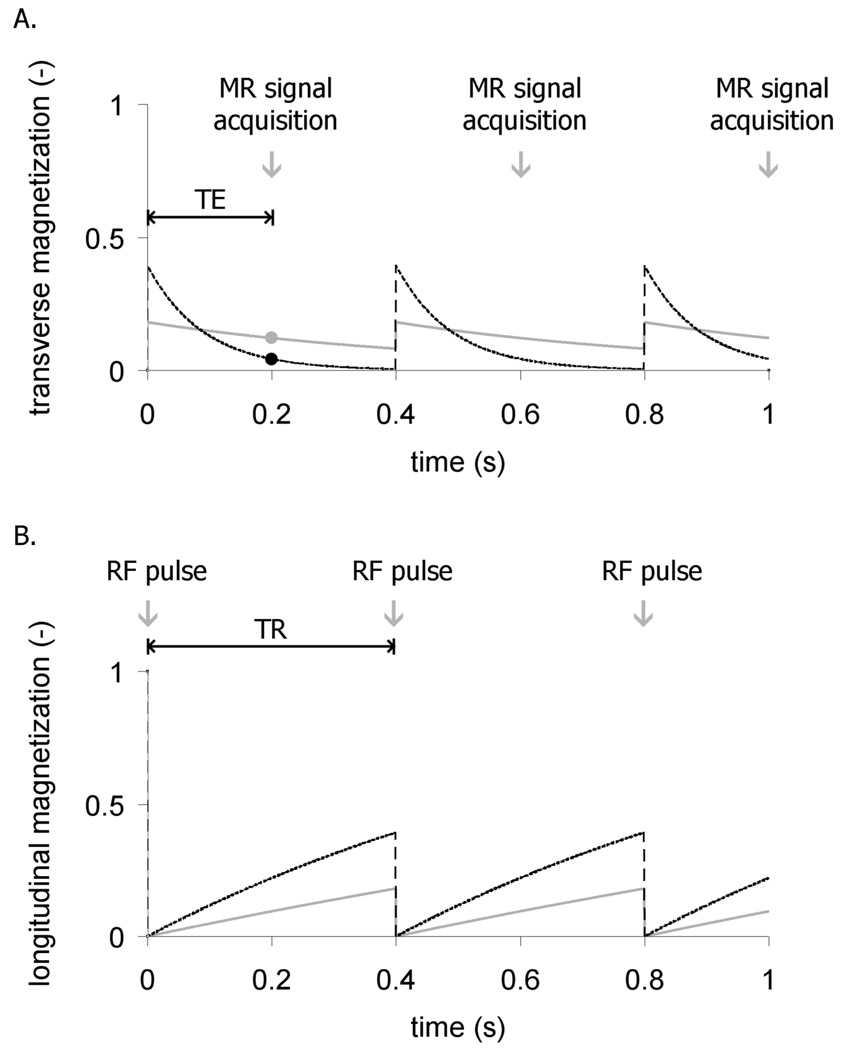
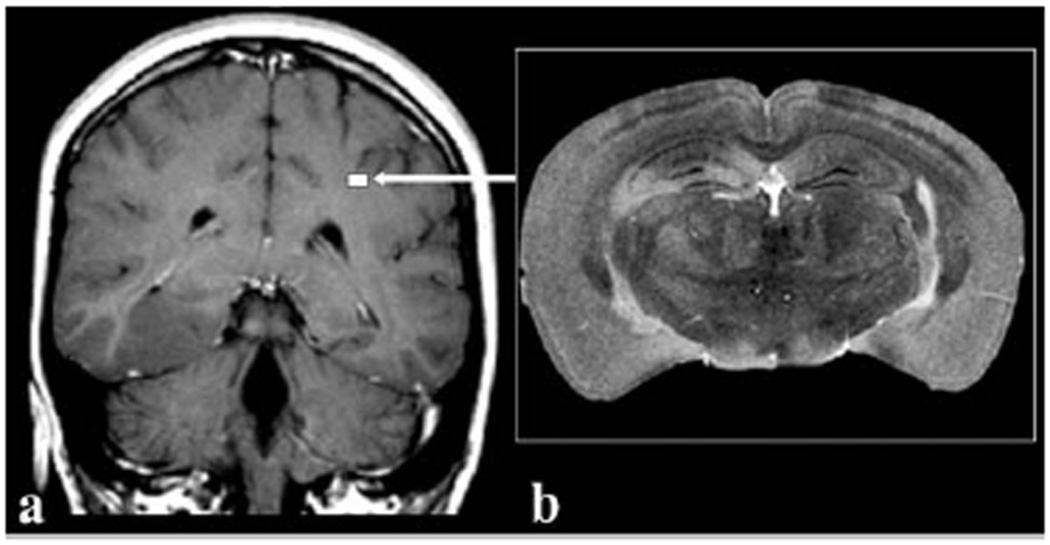
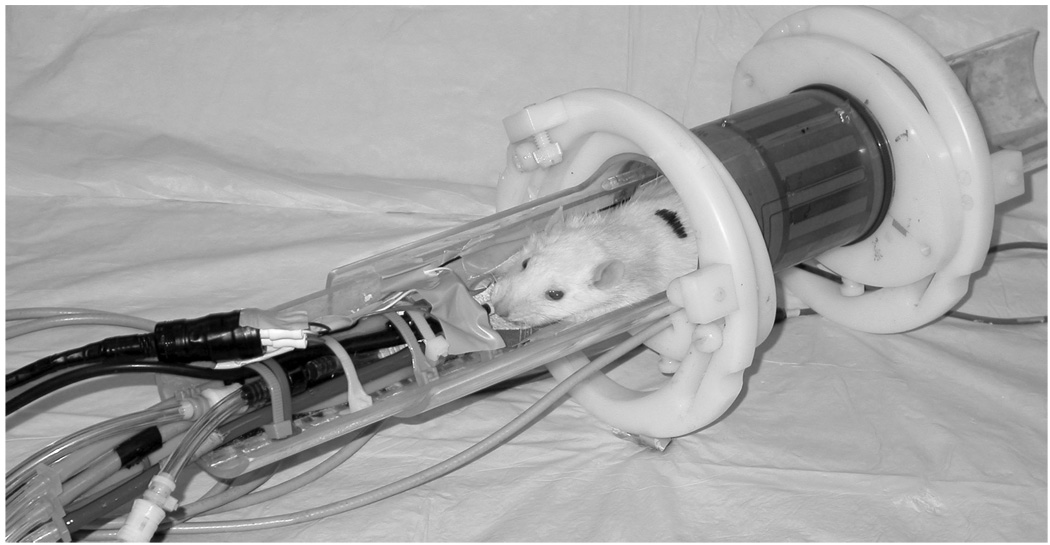
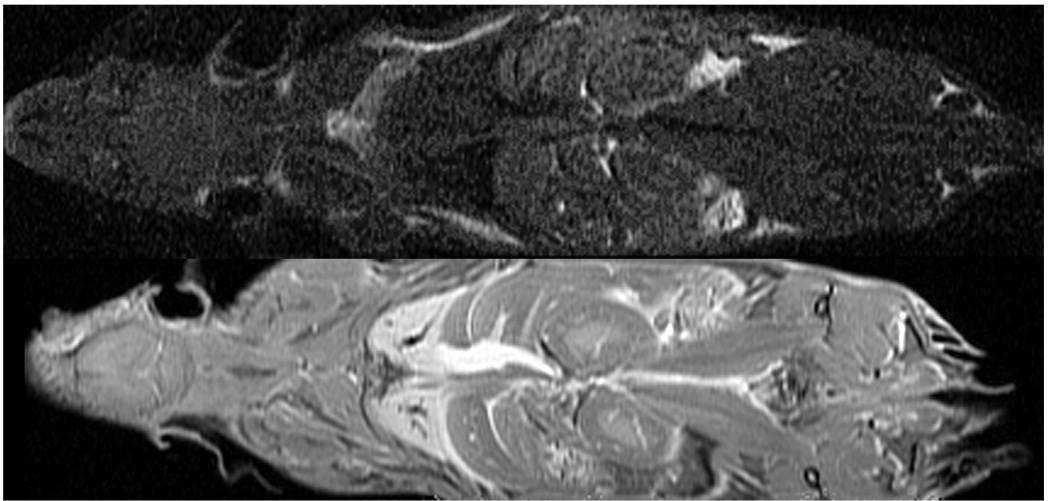
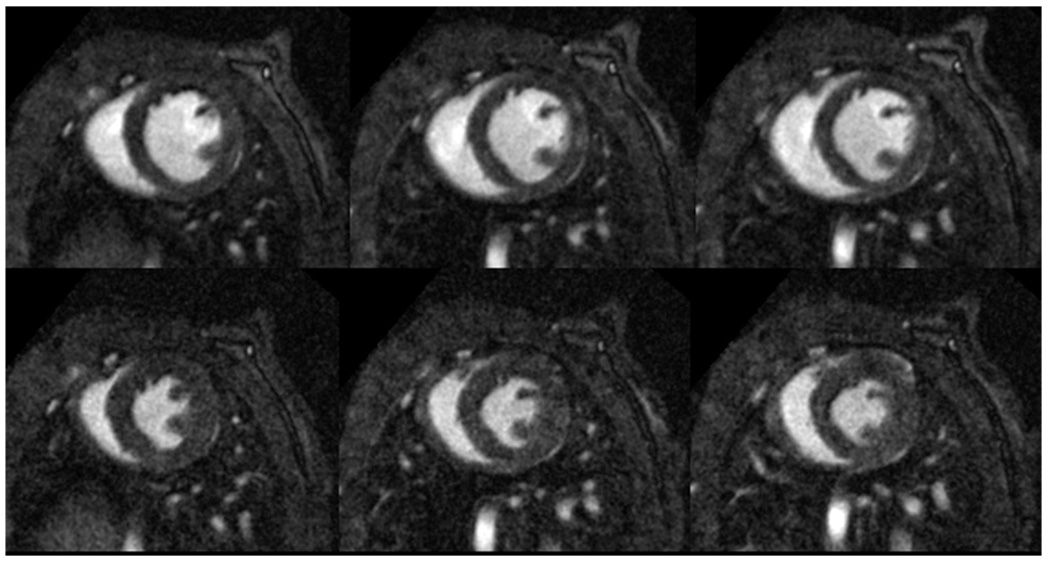
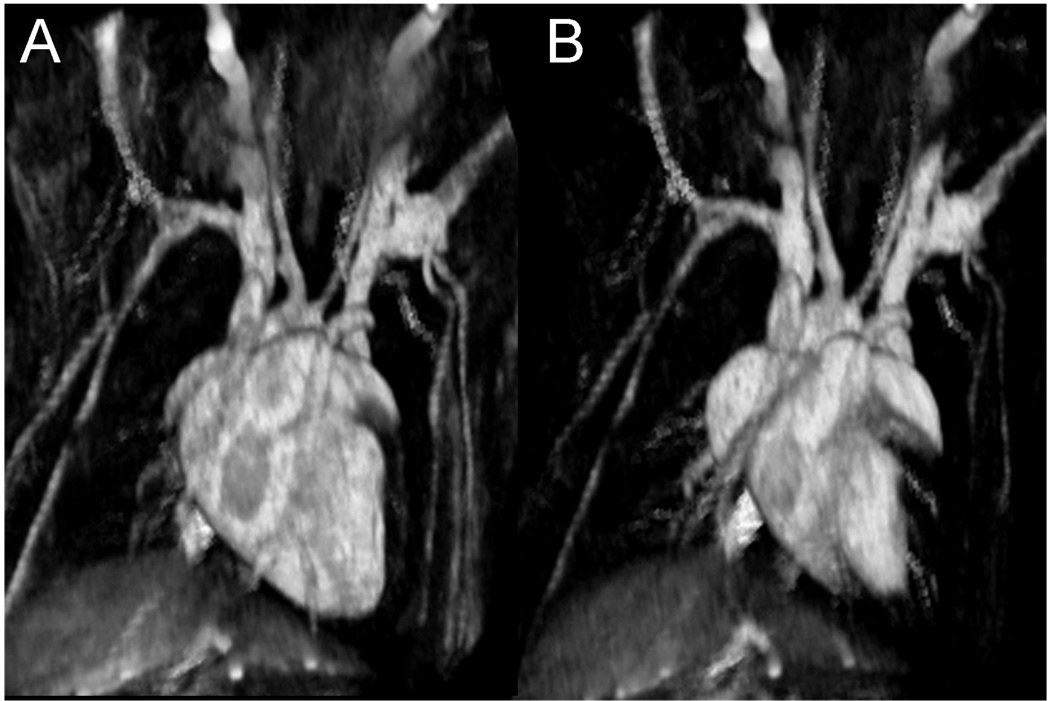
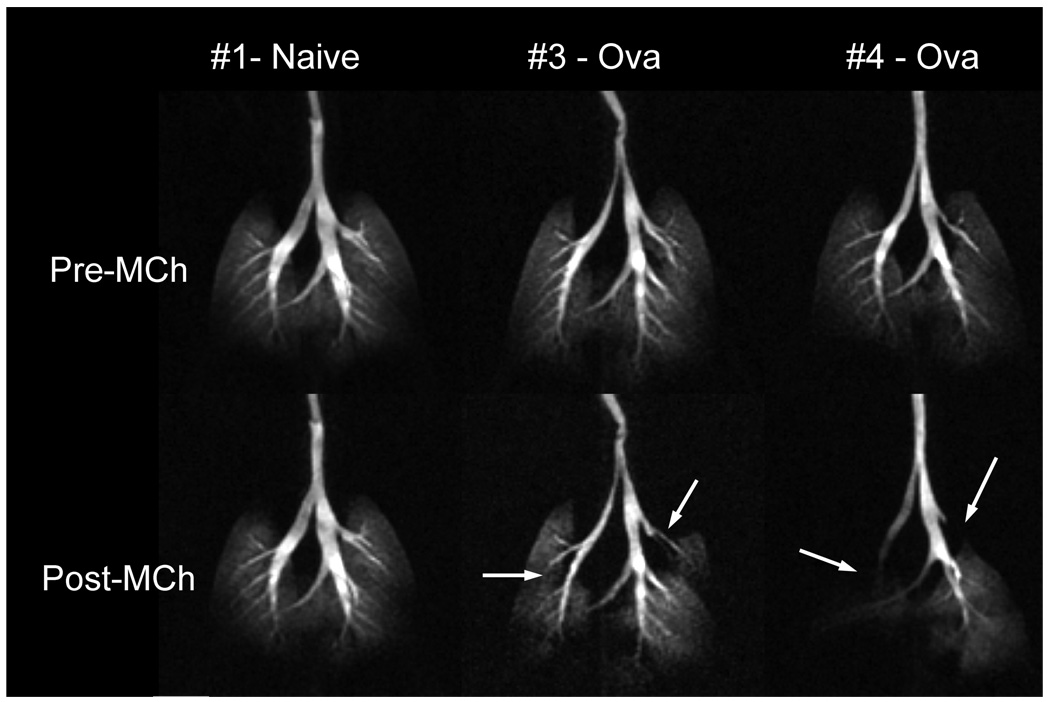
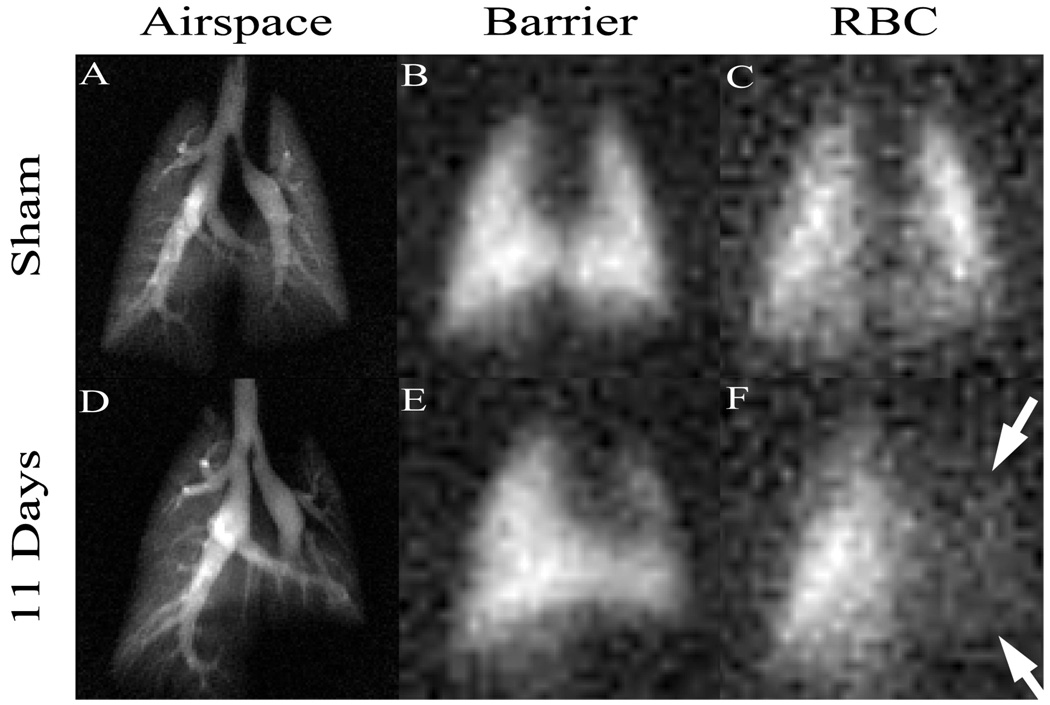
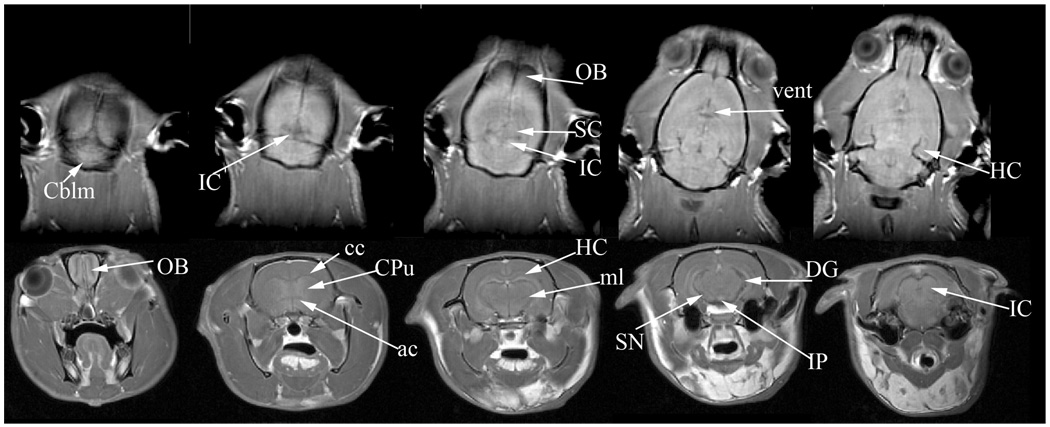
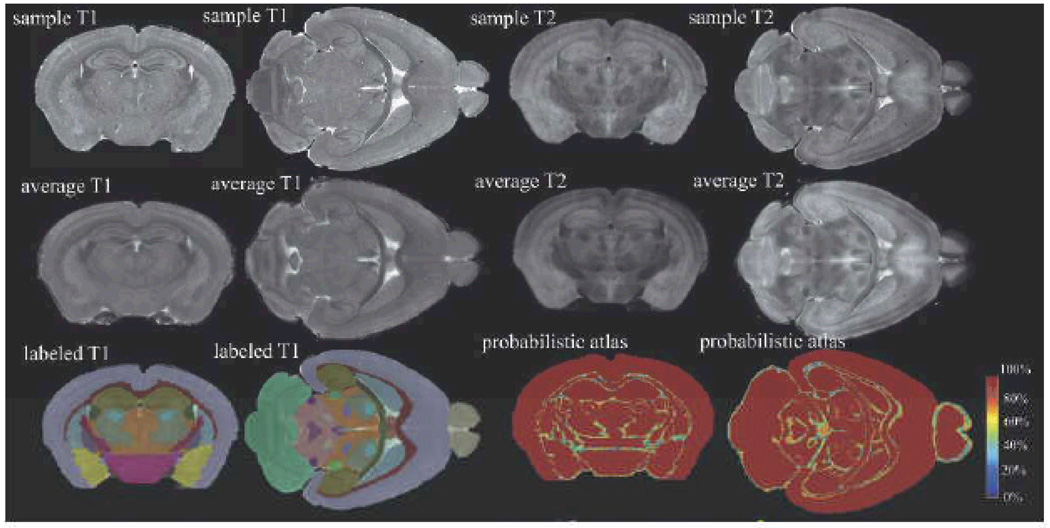
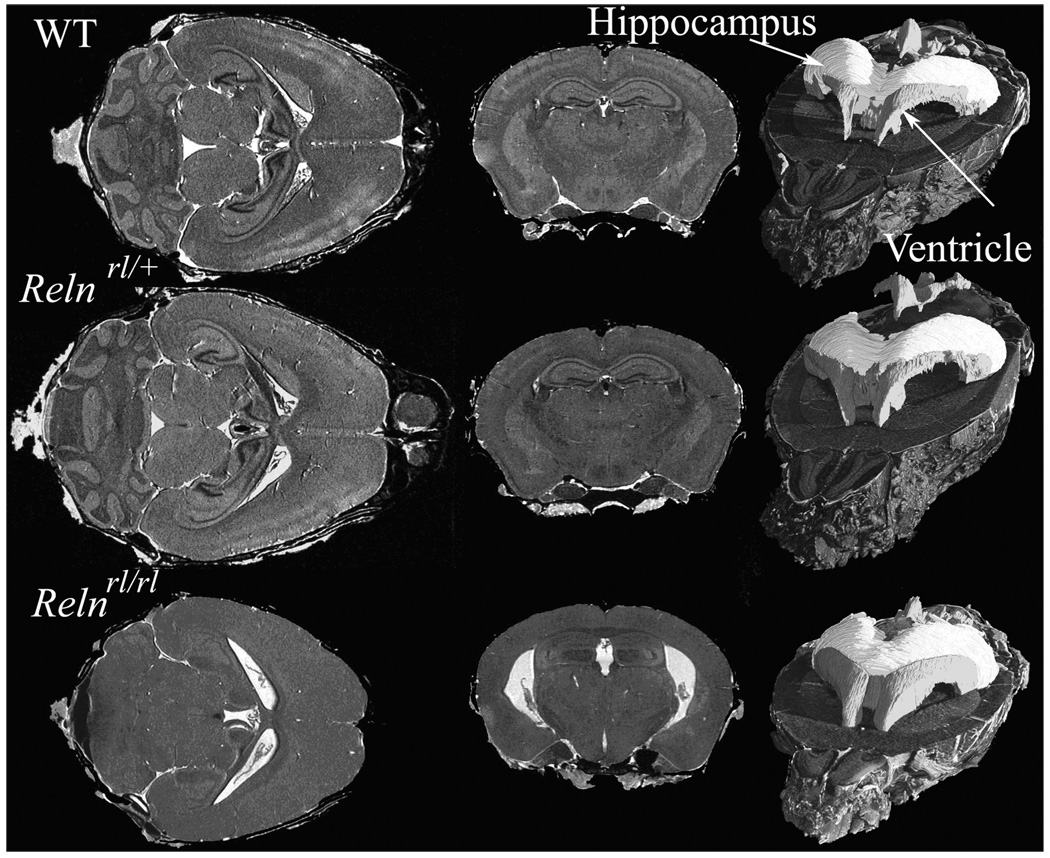
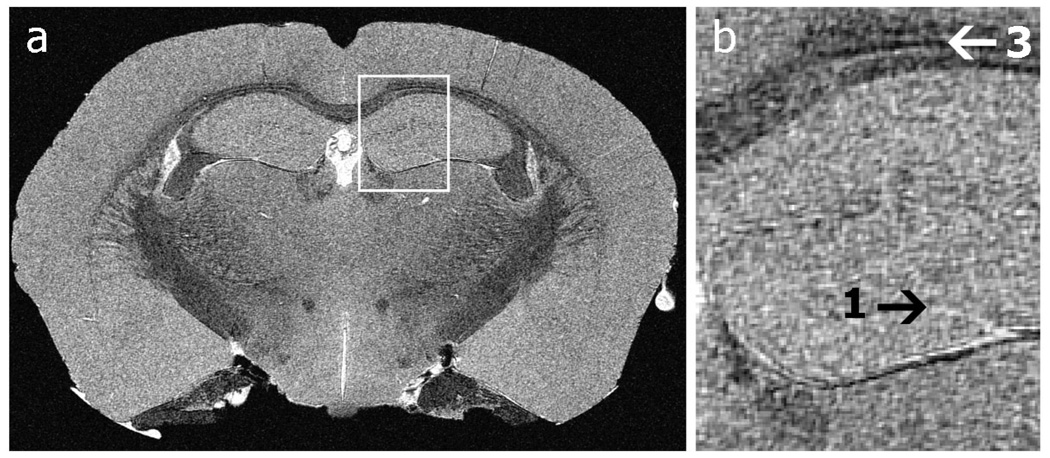
Small animal magnetic resonance microscopy (MRM) has evolved significantly from testing the boundaries of imaging physics to its expanding use today as a tool in noninvasive biomedical investigations. MRM now increasingly provides functional information about living animals, with images of the beating heart, breathing lung, and functioning brain. Unlike clinical MRI, where the focus is on diagnosis, MRM is used to reveal fundamental biology or to noninvasively measure subtle changes in the structure or function of organs during disease progression or in response to experimental therapies. High-resolution anatomical imaging reveals increasingly exquisite detail in healthy animals and subtle architectural aberrations that occur in genetically altered models. Resolution of 100 mum in all dimensions is now routinely attained in living animals, and (10 mum)(3) is feasible in fixed specimens. Such images almost rival conventional histology while allowing the object to be viewed interactively in any plane. In this review we describe the state of the art in MRM for scientists who may be unfamiliar with this modality but who want to apply its capabilities to their research. We include a brief review of MR concepts and methods of animal handling and support, before covering a range of MRM applications-including the heart, lung, and brain-and the emerging field of MR histology. The ability of MRM to provide a detailed functional and anatomical picture in rats and mice, and to track this picture over time, makes it a promising platform with broad applications in biomedical research.


Figures

Figure 1
Figure 1
Repetition time (TR) and echo time (TE) can differentiate tissues depending on their T1 and T2 values. (a) A 90° rf pulse converts the longitudinal magnetization into transverse magnetization to generate an imaging signal. The signal acquisition is delayed by an echo-time TE to distinguish tissues with different T2 values. In this example, a tissue with short T2 (dashed black line) diminishes quickly before the signal is recorded (black dot) while the tissue with a long T2 (solid gray) retains more signal (gray dot). (b) The radiofrequency excitation occurs every TR, creating transverse magnetization (signal), but depleting longitudinal magnetization which recovers with exponential time constant T1. In this example, white matter with T1 = 0.8 s (dashed black) recovers more quickly than cerebrospinal fluid with T1 = 2 s (solid gray).
Figure 2
Figure 2
Comparison of (a) a clinical MR image of a 5-mm thick slice of human brain imaged at 1×1 mm2 in-plane resolution compared to (b) a 40 µm thick slice of a mouse brain imaged at 40×40 µm2 resolution. The size of the mouse brain relative to the human brain is depicted by the white square (arrow). The voxels in the mouse brain image represents a volume 80,000 times smaller than the voxels in the clinical image. Reproduced with permission from Maronpot, Tox Path 2004.
Figure 3
Figure 3
A 250 g rat prepared for imaging in a 2 T system using a 6 cm diameter bird cage coil. The animal is lying on a Plexiglas cradle and is anesthetized with isoflurane delivered by mechanical ventilation. The hoses to the left are for ventilation gases and the black cables carry signals from ECG electrodes on the foot pads, airway pressure transducer on the breathing valve attached to the endotracheal tube, and body temperature from a thermistor in the rectum. The gray cable connects the coil to the MR scanner.
Figure 4
Figure 4
Coronal 2-mm-thick sections were acquired in a formalin-fixed specimen and a specimen stained with a 1:20 mixture of gadopentetate dimeglumine and formalin. At TR of 100 ms, the gain in signal-to-noise ratio is five-fold for all tissues except fat. Reprinted with permission from Johnson, Radiology 2002.
Figure 5
Figure 5
Sample mid-coronal slices of (1) a 13.5-day embryo, (b) an 18.5-day fetus, and (c) a 4-day pup. The two pre-natal specimens were prepared by immersion in Bouins fixative with MR contrast ProHance (20:1, v/v), and the post-natal specimen was prepared by ultrasound-guided trasncardial perfusion of fixative and stain. All three specimens show the liver (liv), parts of the gastro-intestinal tract (gi), and left and right ventricles of the heart (h). Notice that blood appears in the heart of the two pre-natal specimens, but not in the post-natal ones as it was flushed out during perfusion. The E13.5 embryo also shows the mesencephalic vesicle (mv), a precursor of brain’s ventricular system. The E18.5 fetus shows the right atrium (ra), and salivary glands (slg). The PND4 shows part of the right lung (lg), the bladder (bl), and the stomach (st) as well as much smaller structures such as the left/right optic nerves (white arrows) and the mitral valve (black arrow). All three specimens were imaged in a 9.4 T scanner, using a matrix size of 1024×512×512, TR/TE = 75/5.2 ms. The two pre-natal specimens were scanned at an isotropic resolution of 19.5µm3 in a time of 6h 22 min, and the post-natal specimen was scanned at an isotropic resolution of 39µm3 in a time of 3 h 11 min.
Figure 6
Figure 6
Perfusion fixation/staining method for neonatal mice. The primary image shows the post-natal day 4 mouse (2.2 grams), lying in a cradle (lower right inset). Surgical anesthesia is maintained by isoflurane delivered by the purple nose-cone shroud. Immediately above the mouse’s chest is a layer of gel and an ultrasound transducer (40 MHz). On the left are the hoses for saline flush and formalin fixation, which are attached to a 30-gauge catheter inserted into the left ventricle, and supplied by a syringe pump. The upper left inset shows the monitor display from the ultrasound system (VisualSonics, Toronto, CA) showing that the catheter (white arrow) has penetrated the chest wall and the tip is in the left ventricle. The upper right inset shows a closer view of the catheter (black arrows) insertion through the gel, into the left ventricle with the US probe above.
Figure 7
Figure 7
Perfusion fixation/staining method for rats and mice. Catheters are inserted in the right jugular vein and the left carotid artery. The animal is heparinized and then jugular vein infusion begins with saline/gadolinium (Sal-Gd) while blood is simultaneously withdrawn from the carotid artery to flush the cardiopulmonary system (thorax panel). Second, the head is flushed and fixed by infusion of Sal-Gd followed by formalin/gadolinium (Form-Gd) into the left carotid artery, with drainage from the cranial jugular veins (head panel). Third, infusion of Form-Gd continues into the carotid artery with drainage from the femoral arteries (abdomen – artery panel). Finally, infusion of Form-Gd continues into the jugular vein (right) with drainage from the femoral vessels (abdomen – vein panel).
Figure 8
Figure 8
Four representative slices from a perfusion-fixed 19 g C57BL/6 mouse, imaged at 7 T with in-plane resolution of 63×63 µm2. A. Mid-thoracic level showing the vena cava (VC) within the accessory lobe of the right lung and below that is the main bronchus of the middle lobe of the right lung (dark area). The black arrow points to the circular profiles of the esophagus, abdominal aorta, and azygous vein (in order). Also seen are the right and left ventricles (RV, LV) of the heart. The lower white arrow points to the spinal cord, which is seen in all panels. B. Upper abdominal level image showing liver lobes surrounding a loop of the small intestine (SI), vena cava (VC), and the stomach (STOM) to the animal’s left. C. Image slice from slightly lower in the abdomen showing more loops of the small intestine (SI) and part of the stomach (STOM), as well as the right kidney (RK), a section of the spleen (SP) and fragments of the pancreas (arrow). D. Further into the abdomen the right kidney and also the left kidney (LK) are visible, and loops of the large intestine (LI), which are dark because of the lack of water, fragments of the pancreas, and a section of the spleen to the animal’s left.
Figure 9
Figure 9
Three short-axis slices of a 3D acquisition of a C57BL/6 mouse heart in diastole (top row) and systole (bottom row). Resolution is 87×87×348 µm3 and total acquisition time for the 4D (3D, plus time) dataset was 15 minutes. Note the excellent contrast between blood and myocardium that allows for the visualization of papillary muscles and interior structure in the heart.
Figure 10
Figure 10
3D visualization of a C57/BL6 mouse heart at diastole (a) and systole (b). Note the reduced size of the left and right ventricle and the visualization of surrounding blood vessels in the heart.
Figure 11
Figure 11
3D 3He images of three BALB/C mice represented as maximum intensity projections. Top row shows mice before and bottom row shows mice after challenge with 25µg/kg methacholine (MCh) to induce broncho-constriction. From left to right in the figure are one naive mouse and two mice sensitized to ovalbumin to exhibit asthma. The ova-sensitized mice respond to MCh with severe narrowing of several major airways. Such regional visualization of ventilation redistribution is a powerful new tool in asthma research. Images were acquired using a 3D radial sequence with 125×125×1000 µm3 resolution in a time of 5.8 min, FOV = 32×32×16 mm, matrix = 256×256×16, TR/TE = 5/0.2 ms. (Reprinted from Driehuys, Accepted)
Figure 12
Figure 12
Hyperpolarized 129Xe MR images in three compartments of the lung. The ability to separately image uptake of 129Xe from the pulmonary airspaces (A,D) into the pulmonary tissue barrier (B,E) and red blood cells (C,F) is especially powerful for detection of gas exchange impairment. Such impairment is seen in (F), where 129Xe uptake in red blood cells has been diminished by inflammation and fibrosis caused by instillation of bleomycin. This agent creates thickening of the blood-gas barrier, causing 129Xe (or oxygen) to take longer to reach the red blood cells. Such direct visualization of gas exchange is uniquely enabled by the large frequency shift of 129Xe which allows separate imaging of the three compartments. Images were acquired using a 2D radial sequence with 0.3×0.3mm2 resolution in airspaces and 1×1mm2 in tissues in a time of 2 min. (Reprinted from Driehuys, 2006)
Figure 13
Figure 13
In vivo imaging of the rat brain at a resolution of 250×250×1000µm3. The top row shows horizontal slices progressing in the dorsal to ventral direction. The bottom row shows axial slices progressing in the rostral to caudal direction. The images reveal several structures including the olfactory bulbs (OB), cerebellum (Cblm), corpus calossum (cc), anterior commissure (ac), hippocampus (HC) and its dentate gyrus (DG), medial lemniscus (ml), superior and inferior colliculi (SC, IC), and ventricles (vent). All images were acquired using a 3D spin echo protocol at 62.5 kHz bandwidth and a matrix of 256×128×32. The top row images were acquired with FOV=64×32×32 mm3 , TR/TE=1500/4.0 ms. The bottom row images were acquired with FOV=40×40×45 mm3, TR/TE=400/5.1 ms.
Figure 14
Figure 14
MRM is used to create a labeled atlas for the C57BL/6 mouse brain. The top row shows axial and horizontal image slices of T1- and T2-weighted datasets from fixed brain specimens acquired with 21.5µm3 resolution. Such images from multiple brains are co-registered and combined to create average brain images (middle row), which are then segmented to identify individual brain structures and create a labeled atlas (bottom row, 1st and 2nd columns). An additional measurement of interest is the variability of structures within the species. Variability is captured in a probabilistic atlas (bottom row, 3rd and 4th column), which exhibits in each voxel the level of agreement of all labels, in all brains. Regions of low agreement are found at the border of structures and in regions where small structures are in close vicinity. All images were acquired with a 3D spin echo sequence, matrix size of 1024×512×512, TR/TE= 50/5.2ms.
Figure 15
Figure 15
T1-weighted images of the brains of wild type (WT) and mice with heterozygous and homozygous Reln mutation. These images of fixed perfused mouse brains were acquired at 21.5 µm3 resolution and segmented to show the ventricles and hippocampus. Horizontal sections in the homozygous Reeler mutant show severe atrophy in the cerebellum compared to the heterozygous mutant and WT. The heterozygous mutant also shows disturbances in the layered structures of the cortex and hippocampus, as well as enlarged ventricles. The right column shows segmentation of hippocampus (light gray) and ventricles (dark gray) which indicate shape differences among the three genotypes. Images were acquired using a 3D spin echo sequence with TR/TE=50/51 ms, FOV=22×11×11 mm, a 1024×512×512 matrix.
Figure 16
Figure 16
(a) a 10-micron in-plane resolution, coronal slice through the mouse hippocampus. (b) Anatomical features unseen at the resolution achievable with copper coils become apparent: the transitions between layers (arrow 1) in the hippocampus and the layering of the corpus callosum (arrow 2) are visible. Images were acquired using a GRE sequence, 90° flip angle, TR/TE=100/5.5 ms, FOV=21.3×10.6×10.6 mm3, Bandwidth=62.5 kHz, resolution of 10×10×20 µm3.

Similar articles

Cited by

References

    1. Ahrens ET, Dubowitz DJ. Peripheral somatosensory fMRI in mouse at 11.7 T. NMR Biomed. 2001;14:318–324. - PubMed
    1. Ali AA, Dale AM, Badea A, Johnson GA. Automated segmentation of neuroanatomical structures in multispectral MR microscopy of the mouse brain. Neuroimage. 2005;27:425–435. - PubMed
    1. Altes TA, Powers PL, Knight-Scott J, Rakes G, Platts-Mills TAE, DeLange EE, Alford BA, Mugler JP, Brookeman JR. Hyperpolarized 3He MR Lung Ventilation Imaging in Asthmatics: Preliminary Findings. J. Mag. Res. Imag. 2001;13:378–384. - PubMed
    1. Badea A, Nicholls PJ, Johnson GA, Wetsel WC. Neuroanatomical phenotypes in the Reeler mouse. Neuroimage. 2007;34:1363–1374. - PMC - PubMed
    1. Badea C, Hedlund LW, Johnson GA. Micro-CT with respiratory and cardiac gating. Med Phys. 2004;31:3324–3329. - PMC - PubMed

Publication types