. 2008;49(1):103-15.
doi: 10.1093/ilar.49.1.103.

Noninvasive bioluminescence imaging in small animals

Affiliations

Noninvasive bioluminescence imaging in small animals

Kurt R Zinn et al. ILAR J. 2008.

Abstract

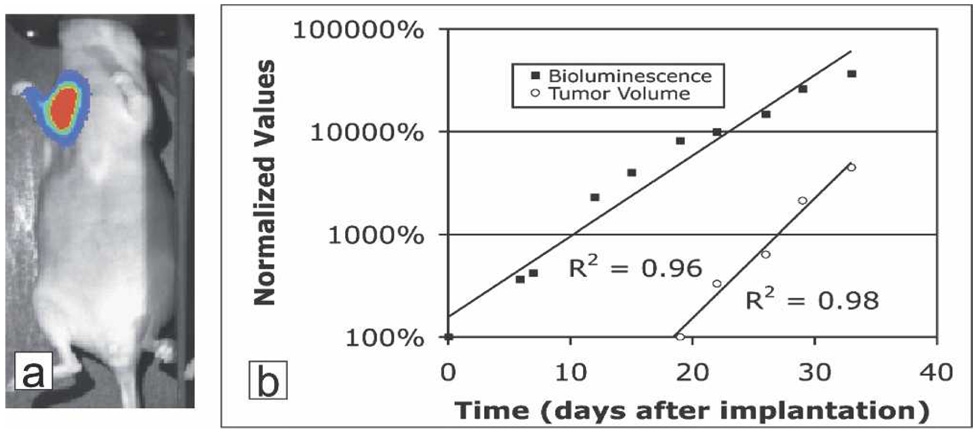
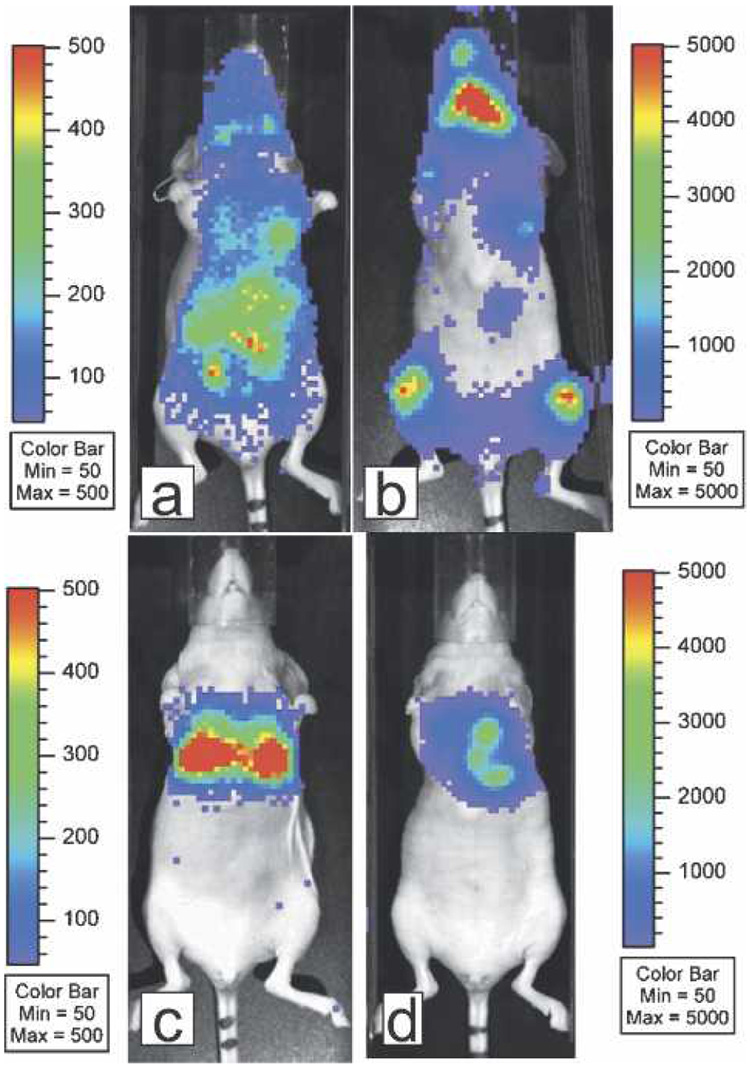
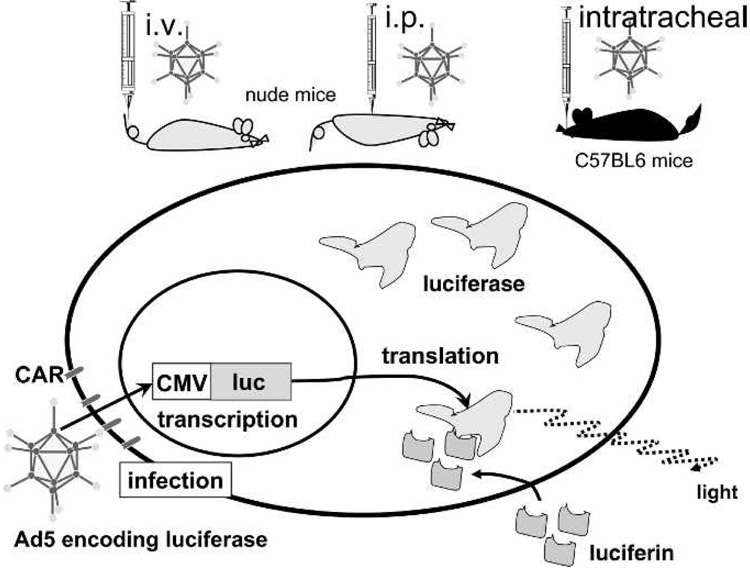
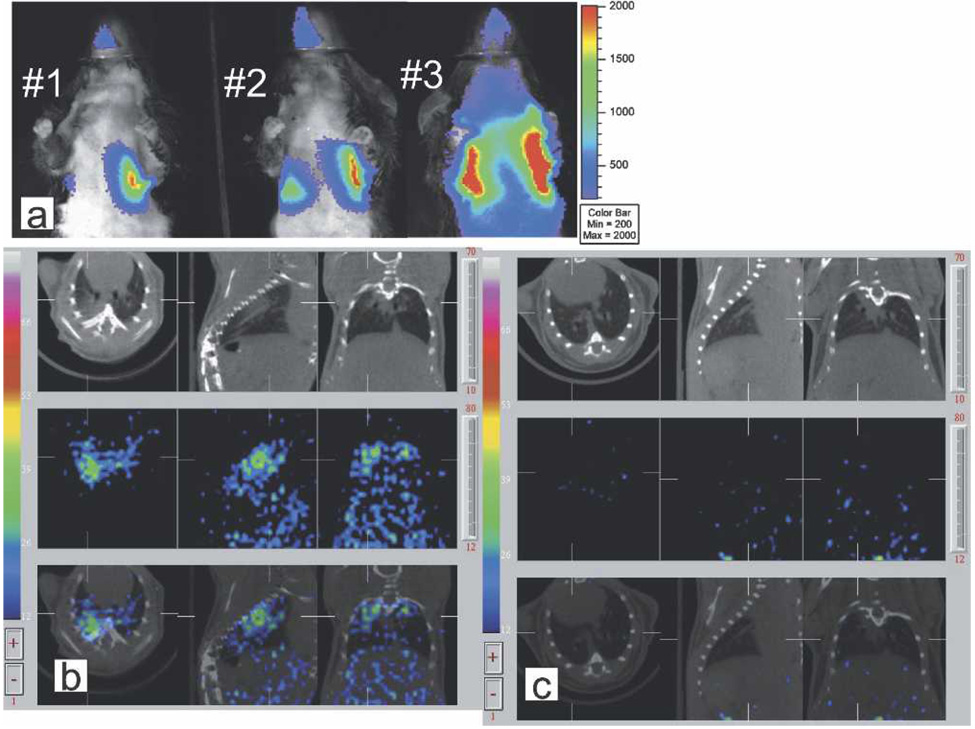
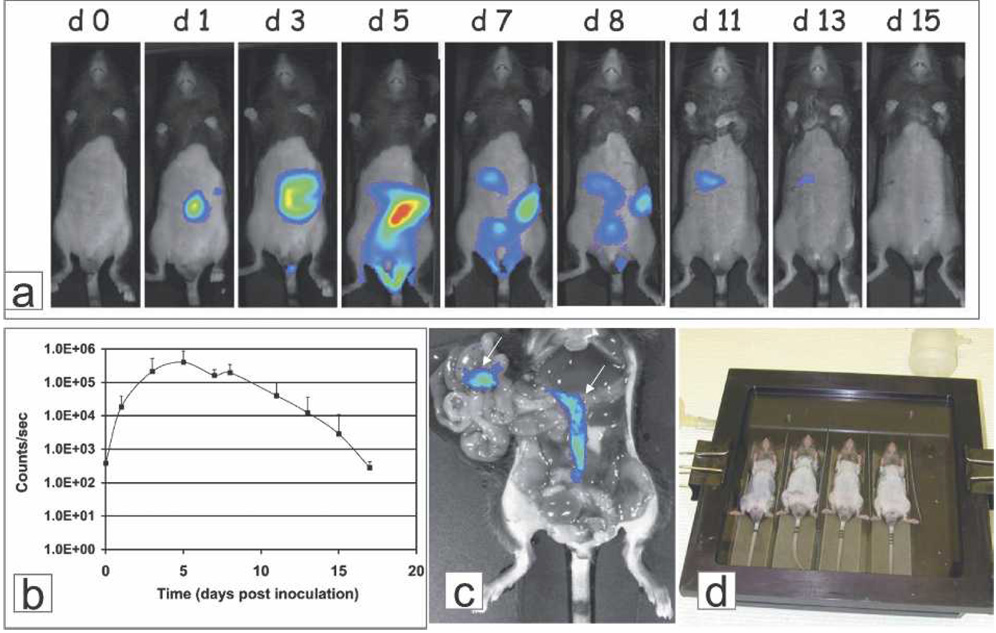
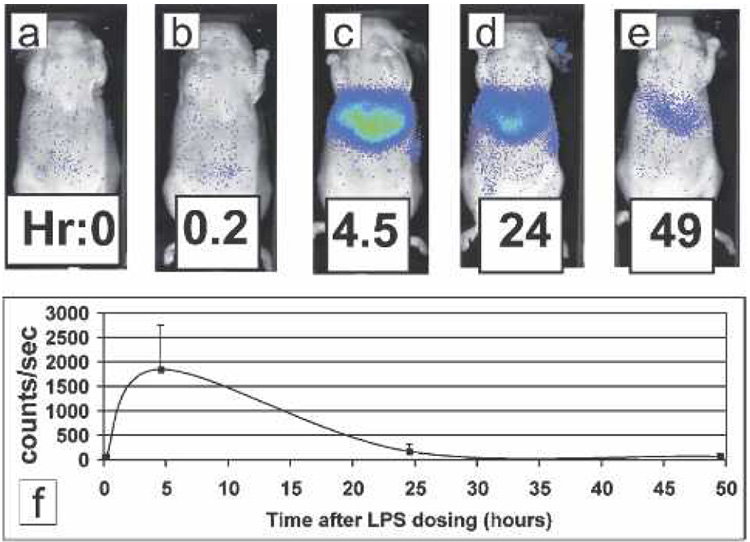
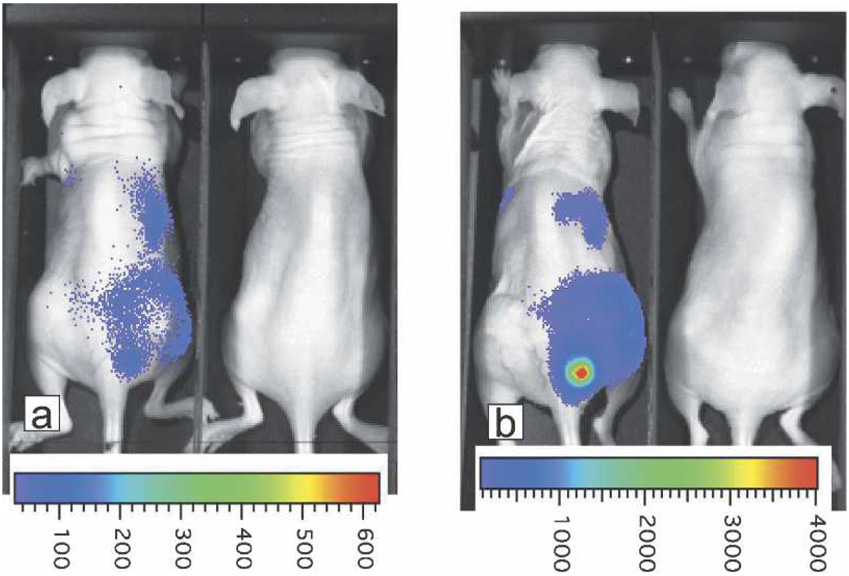
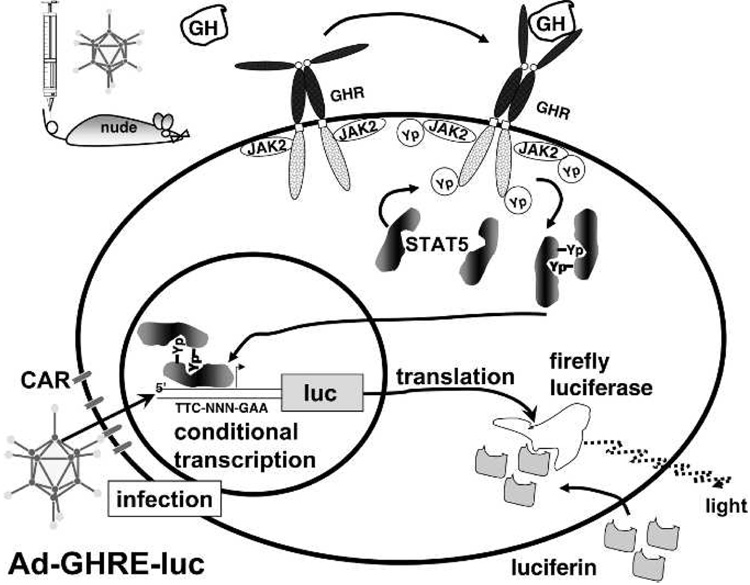
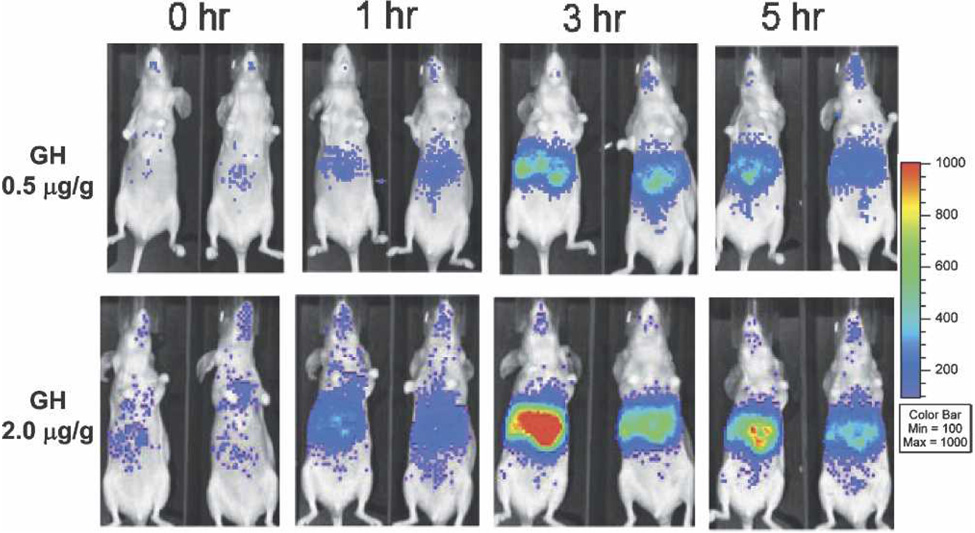
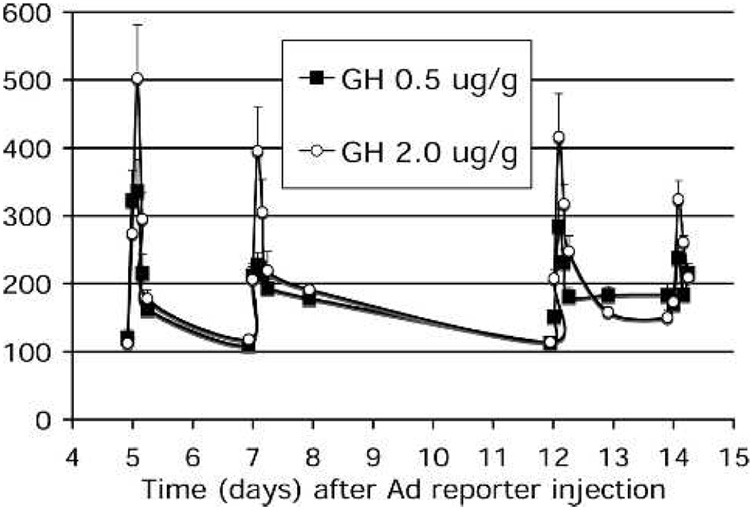
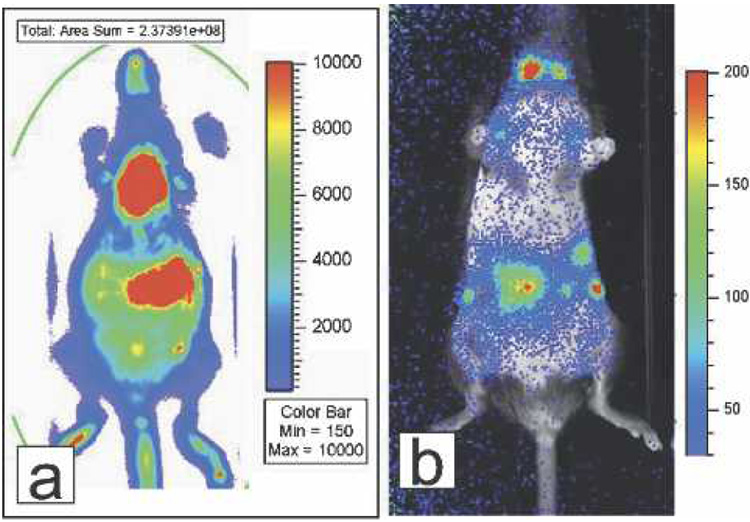
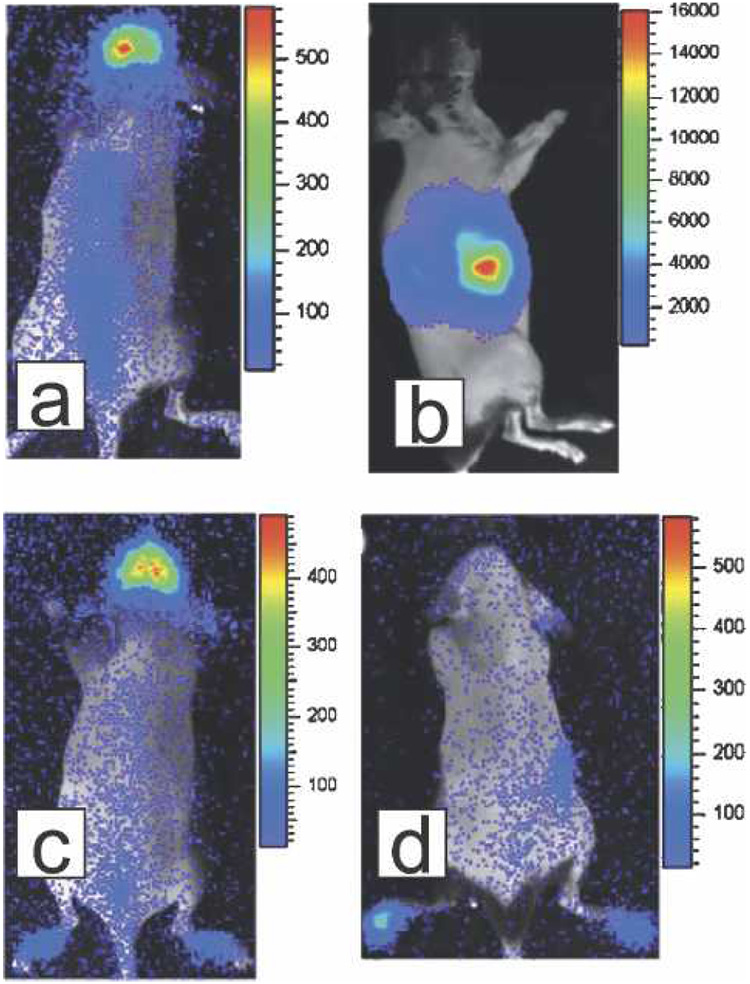
There has been a rapid growth of bioluminescence imaging applications in small animal models in recent years, propelled by the availability of instruments, analysis software, reagents, and creative approaches to apply the technology in molecular imaging. Advantages include the sensitivity of the technique as well as its efficiency, relatively low cost, and versatility. Bioluminescence imaging is accomplished by sensitive detection of light emitted following chemical reaction of the luciferase enzyme with its substrate. Most imaging systems provide 2-dimensional (2D) information in rodents, showing the locations and intensity of light emitted from the animal in pseudo-color scaling. A 3-dimensional (3D) capability for bioluminescence imaging is now available, but is more expensive and less efficient; other disadvantages include the requirement for genetically encoded luciferase, the injection of the substrate to enable light emission, and the dependence of light signal on tissue depth. All of these problems make it unlikely that the method will be extended to human studies. However, in small animal models, bioluminescence imaging is now routinely applied to serially detect the location and burden of xenografted tumors, or identify and measure the number of immune or stem cells after an adoptive transfer. Bioluminescence imaging also makes it possible to track the relative amounts and locations of bacteria, viruses, and other pathogens over time. Specialized applications of bioluminescence also follow tissue-specific luciferase expression in transgenic mice, and monitor biological processes such as signaling or protein interactions in real time. In summary, bioluminescence imaging has become an important component of biomedical research that will continue in the future.


Figures

Figure 1
Figure 1
(A) Bioluminescence imaging of a representative mouse at 7 days after implantation of luciferase-positive 2LMP cells in the mammary fat pad. (B) The summary graph (based on imaging and measurements of 5 mice) comparing bioluminescence with tumor measurements of volume using calipers. Imaging data and caliper measurements were normalized to the initial values for each mouse and hence begin at 100%. The original figure is in color and is available in the online posting of this article at www.ilarjournal.com.
Figure 2
Figure 2
Bioluminescence imaging of 200,000 luciferase-positive MDA-MB-435 cells immediately (A,C) or 33 days (B,D) after injection into the left (A,C) or right (C,D) ventricle. Disseminated metastases or focal lung lesions are shown resulting from left or right ventricular injection, respectively. Imaging times vary due to saturation at later acquisition time. A 120-second acquisition was taken for both day 0 images (A,C); day 40 images required only a 10-second duration (B,D). The original figure is in color and is available in the online posting of this article at www.ilarjournal.com.
Figure 3
Figure 3
A diagram showing injection of the replication-incompetent Ad5 vector by three different routes, together with a figure showing the mechanism of luciferase expression in an individual cell. CAR, coxsackie and adenovirus receptor; CMV, cytomegalovirus promoter; luc, luciferase.
Figure 4
Figure 4
Bioluminescence imaging at (A) 6 hours or (B) 13 days after dosing with the replication-incompetent Ad5 vector encoding luciferase, together with (C) a summary graph of mean light emission (error bars are standard deviations) for all mice at all imaging time points. i.v., intravenous; i.p., intraperitoneal. The original figure is in color and is available in the online posting of this article at www.ilarjournal.com.
Figure 5
Figure 5
Imaging of (A) luciferase expression at 24 hours after controlled intratracheal delivery of replication-incompetent Ad-Luc-hSSTr2 (4 × 10⁸ pfu) in three BL/6 mice, (B) mouse #3 by SPECT/CT 5 hours after i.v. hSSTr2-avid Tc-99m-P2045 showing Ad-specific hSSTr2 lung expression, and (C) a control mouse without lung hSSTr2 expression. The original figure is in color and is available in the online posting of this article at www.ilarjournal.com.
Figure 6
Figure 6
Bioluminescence imaging of Citrobacter, with (A) a representative mouse imaged over time, (B) summary data for all mice in the group (means with error bars as standard deviations), (C) image showing the location of Citrobacter at termination, and (D) image of the containment chamber for imaging. The original figure is in color and is available in the online posting of this article at www.ilarjournal.com.
Figure 7
Figure 7
Imaging of liver expression of luciferase under control of the cyclooxygenase 2L promoter, (A–E) time course before and after lipopolysaccharide (LPS) injection for a representative mouse, and (F) summary graph for all mice in the group. The original figure is in color and is available in the online posting of this article at www.ilarjournal.com.
Figure 8
Figure 8
Imaging luciferase expression in a breast xenograft at (A) 2 weeks and (B) 3 weeks after intravenous injection of a replication-competent Ad5 vector encoding luciferase. The luciferase expression in the tumor was visualized due to replication of the vector. The pseudo-color scale bars at the bottom represent the intensity of light emission with different colors. The original figure is in color and is available in the online posting of this article at www.ilarjournal.com.
Figure 9
Figure 9
Diagram showing mechanism of growth hormone–induced expression of luciferase. CAR, coxsackie and adenovirus receptor; GHR, growth hormone receptor; GHRE, growth hormone response element; JAK2, Janus kinase 2; luc, firefly luciferase; STAT5, signal transducer and activator of transcription-5; Yp, phosphorylated tyrosine residue; TTC-NNN-GAA, DNA response element for STAT5.
Figure 10
Figure 10
Imaging of growth hormone (GH) signaling over time. Two representative mice from each dosing group (n = 10/group) are presented. The original figure is in color and is available in the online posting of this article at www.ilarjournal.com.
Figure 11
Figure 11
Liver-induced luciferase signal in the two groups of mice dosed with growth hormone (GH) (from Figure 10). Data are expressed as means with error bars as standard deviations. The mice were injected with GH on 4 different days and imaged.
Figure 12
Figure 12
Bioluminescence imaging of luciferase-positive T cells in (A) a founder mouse and (B) representative mouse at 3 weeks after adoptive transfer of 3.5 × 10⁶ luciferase-positive T cells. The original figure is in color and is available in the online posting of this article at www.ilarjournal.com.
Figure 13
Figure 13
In vivo imaging to screen MC4R-transgenic mice driving luciferase. Shown are founders from four different promoter constructs. (A) Founder C1 (3300MC4Luc), prominent activity pattern along midline and brain. (B) Founder B5 (3300MC4Luc3), very strong expression in liver and kidneys. (C) Founder D2 (890MC4Luc), prominent activity in forebrain, weaker along midline. (D) Founder E1 (430MC4Luc), weak activity in abdominal area (not shown) and paws. The original figure is in color and is available in the online posting of this article at www.ilarjournal.com.

Similar articles

Cited by

References

    1. Azadniv M, Dugger K, Bowers WJ, Weaver C, Crispe IN. Imaging CD8+ T cell dynamics in vivo using a transgenic luciferase reporter. Immunol. 2007 (in press). - PubMed
    1. Bhaumik S, Gambhir SS. Optical imaging of Renilla luciferase reporter gene expression in living mice. Proc Natl Acad Sci U S A. 2002;99:377–382. - PMC - PubMed
    1. Brakenhielm E, Burton JB, Johnson M, Chavarria N, Morizono K, Chen I, Alitalo K, Wu L. Modulating metastasis by a lymphangiogenic switch in prostate cancer. Int J Cancer. 2007 - PMC - PubMed
    1. Buchsbaum DJ, Chaudhuri TR, Yamamoto M, Zinn KR. Gene expression imaging with radiolabeled peptides. Ann Nucl Med. 2004;18:275–283. - PubMed
    1. Buchsbaum DJ, Chaudhuri TR, Zinn KR. Radiotargeted gene therapy. J Nucl Med. 2005;46 Suppl 1:179S–186S. - PubMed

Publication types