. 2008 Feb;118(2):722-34.
doi: 10.1172/JCI32702.

Aberrant Phex function in osteoblasts and osteocytes alone underlies murine X-linked hypophosphatemia

Affiliations

Aberrant Phex function in osteoblasts and osteocytes alone underlies murine X-linked hypophosphatemia

Baozhi Yuan et al. J Clin Invest. 2008 Feb.

Abstract

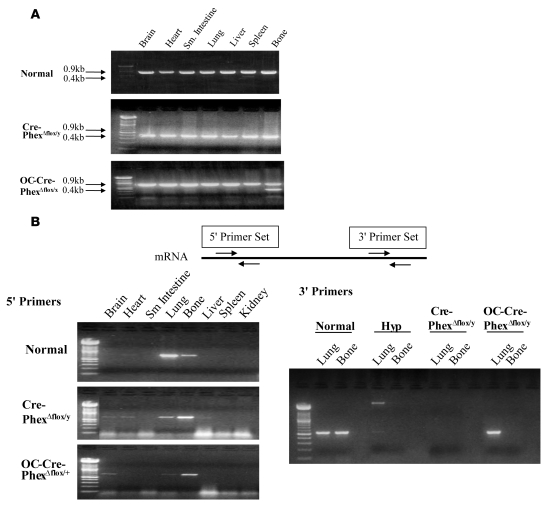
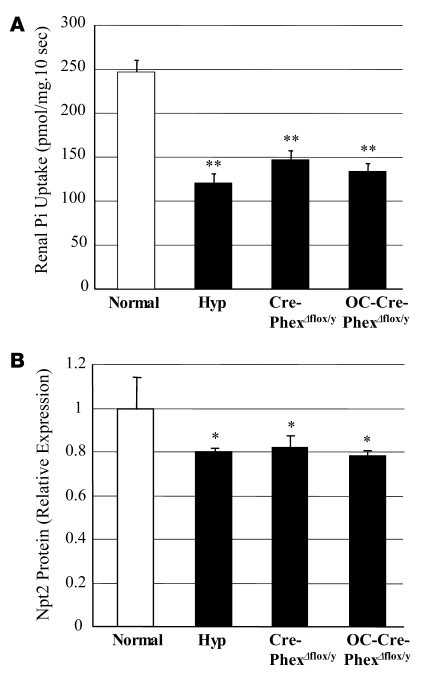
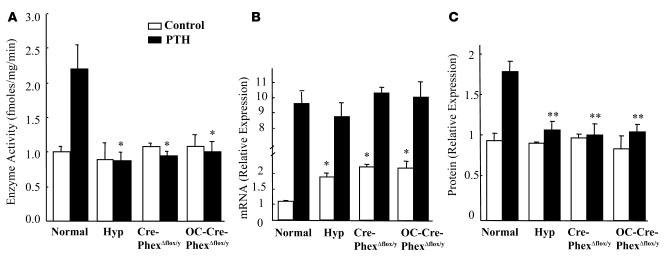
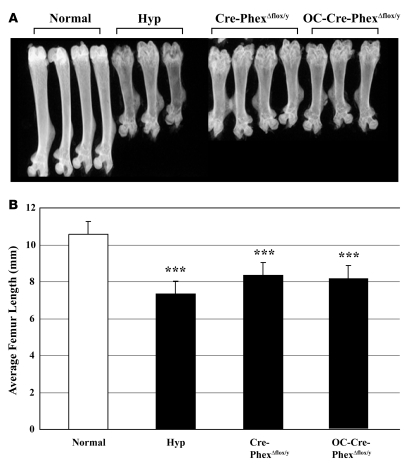
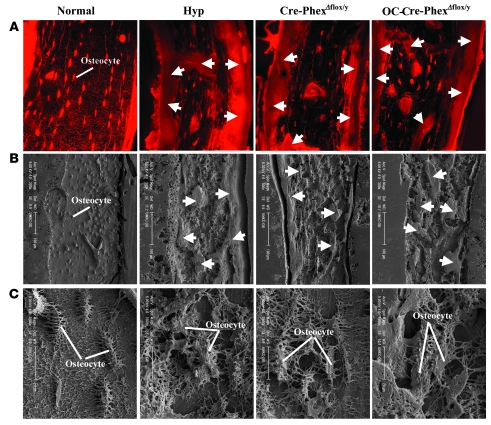
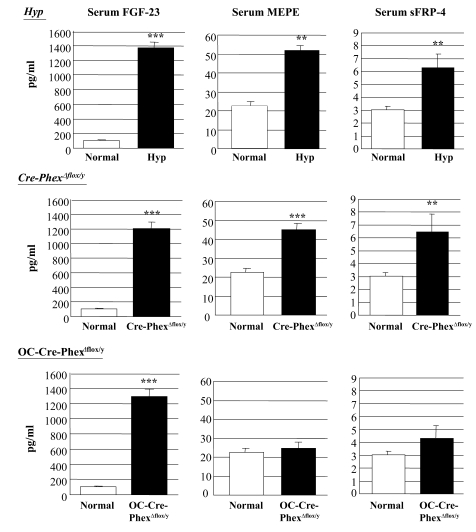
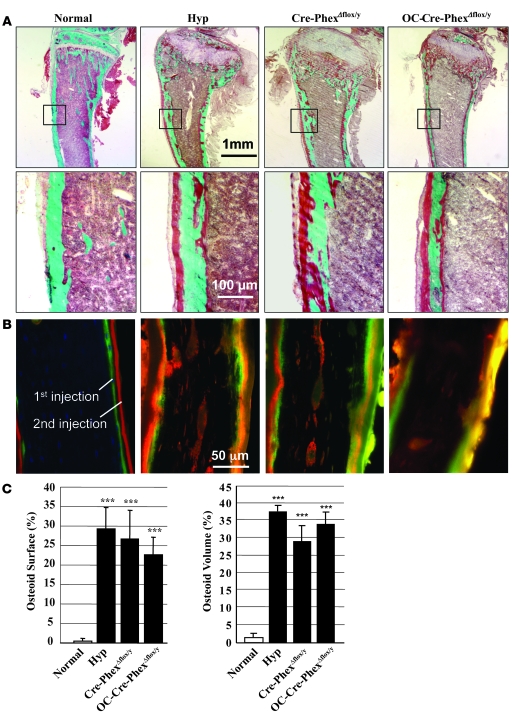
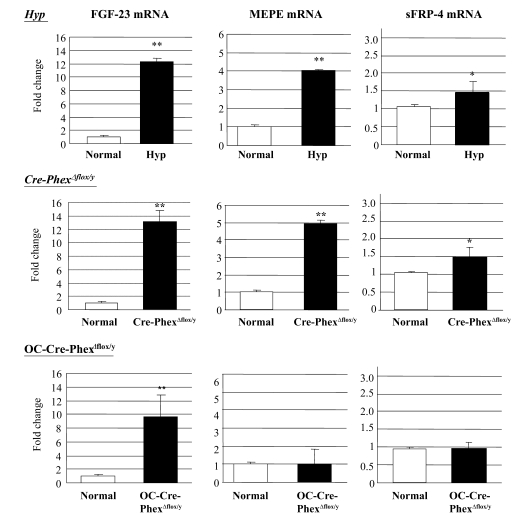
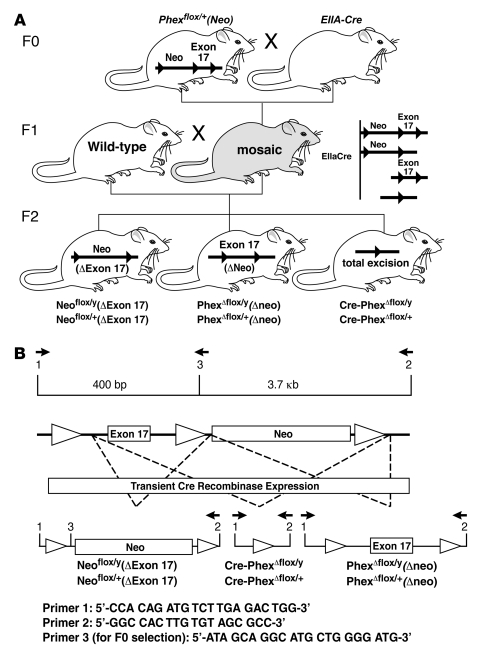
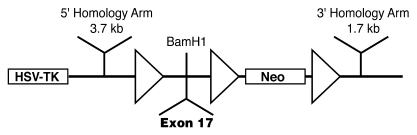
Patients with X-linked hypophosphatemia (XLH) and the hyp-mouse, a model of XLH characterized by a deletion in the Phex gene, manifest hypophosphatemia, renal phosphate wasting, and rickets/osteomalacia. Cloning of the PHEX/Phex gene and mutations in affected patients and hyp-mice established that alterations in PHEX/Phex expression underlie XLH. Although PHEX/Phex expression occurs primarily in osteoblast lineage cells, transgenic Phex expression in hyp-mouse osteoblasts fails to rescue the phenotype, suggesting that Phex expression at other sites underlies XLH. To establish whether abnormal Phex in osteoblasts and/or osteocytes alone generates the HYP phenotype, we created mice with a global Phex knockout (Cre-PhexDeltaflox/y mice) and conditional osteocalcin-promoted (OC-promoted) Phex inactivation in osteoblasts and osteocytes (OC-Cre-PhexDeltaflox/y). Serum phosphorus levels in Cre-PhexDeltaflox/y, OC-Cre-PhexDeltaflox/y, and hyp-mice were lower than those in normal mice. Kidney cell membrane phosphate transport in Cre-PhexDeltaflox/y, OC-Cre-PhexDeltaflox/y, and hyp-mice was likewise reduced compared with that in normal mice. Abnormal renal phosphate transport in Cre-PhexDeltaflox/y and OC-Cre-PhexDeltaflox/y mice was associated with increased bone production and serum FGF-23 levels and decreased kidney membrane type IIa sodium phosphate cotransporter protein, as was the case in hyp-mice. In addition, Cre-PhexDeltaflox/y, OC-Cre-PhexDeltaflox/y, and hyp-mice manifested comparable osteomalacia. These data provide evidence that aberrant Phex function in osteoblasts and/or osteocytes alone is sufficient to underlie the hyp-mouse phenotype.


Figures

Figure 1
Figure 1. Phex DNA genotyping and mRNA expression in knockout mice.
(A) DNA genotyping showed that Phex DNA (0.9 kb) was identified in every tested tissue of normal mice. In contrast, a truncated gene of 0.4 kb was present in all tissues of the global knockout (Cre-PhexΔflox/y) mice, while the targeted knockout mice (OC-Cre-PhexΔflox/y) had the truncated gene only in bone (a female heterozygous mouse was used in these studies to assure conditions were appropriate for gene expression of the 0.9-kb band). (B) Phex mRNA expression. Two sets of primers were used to detect the Phex expression upstream and downstream of exon 17. When using 5ι upstream primers, the Phex gene was mainly expressed in lung and bone tissues in the normal and knockout models. However, when 3ι primers were used, the expression pattern changed, and while Phex mRNA expression was absent from lung and bone of Cre-PhexΔflox/y mice, the OC-Cre-PhexΔflox/y mice lacked Phex mRNA only in bone tissue.
Figure 2
Figure 2. Pi transport across renal brush border membrane and Npt2 protein content in the kidney.
(A) Both knockout mice exhibited decreased renal Pi transport in renal brush border membranes, similar to that in hyp-mice, when compared with the normal controls. (B) Western blotting showed comparable decreases in the renal tubular Npt2 cotransporter in both knockout and hyp-mice when compared with the normal controls. *P < 0.05, **P < 0.01 compared with normal mice.
Figure 3
Figure 3. Effects of Pi and PTH (300 μg/kg/d) stimulation on 25(OH)D-1α-hydroxylase mRNA, protein, and enzyme activity in knockout mice.
(A) In the baseline state, hyp-mice and the knockouts failed to exhibit increased 25(OH)D-1α-hydroxylase activity despite significant hypophosphatemia. PTH significantly increased enzyme activity only in the normal mice and had no effect on 25(OH)D-1α-hydroxylase function in hyp-mice or both knockout mice compared with the corresponding normals. (B) In response to the prevailing hypophosphatemia in the baseline state, the hyp-mice and both knockouts manifested increased mRNA transcripts. In response to PTH stimulation, the hyp-mice and both knockouts exhibited enhancement of the mRNA transcripts similar to that observed in normal mice. (C) The increased mRNA in the hyp- and the knockout mice in the baseline state and following PTH stimulation did not result in enhanced translation of the 25(OH)D-1α-hydroxylase protein when compared with the corresponding normal mice. *P < 0.05, **P < 0.01 compared with corresponding normal mice.
Figure 4
Figure 4. Femur length in normal, hyp-, and knockout mice.
(A) High-resolution radiographics revealed that Cre-PhexΔflox/y and OC-Cre-PhexΔflox/y mice had shortened femurs comparable to those in hyp-mice. (B) The bar graph presents the average femur length in the normal, hyp-, Cre-PhexΔflox/y, and OC-Cre-PhexΔflox/y mice. Compared with normal mice, the hyp-, Cre-PhexΔflox/y, and OC-Cre-PhexΔflox/y mice had significantly decreased femur length. Measurements in at least 6 femurs in each group revealed a significant decrease (averaging 2.5 mm) in femur length in hyp-, Cre-PhexΔflox/y, and OC-Cre-PhexΔflox/y compared with normal mice. ***P < 0.001 compared with normal mice.
Figure 6
Figure 6. Porcine red staining and scanning electron microscopy with acid itch images of bone sections.
(A) The porcine red stain highlights the abundant and well-ordered osteocytes in normal mice and the excessive osteoid (arrows) observed in the hyp-, Cre-PhexΔflox/y, and OC-Cre-PhexΔflox/y mice. (B) Scanning electron microscopic images at low magnification confirm the abundant, well-ordered osteocytes in the normal mice and the abundant osteoid (arrows) in the hyp-, Cre-PhexΔflox/y, and OC-Cre-PhexΔflox/y mice. (C) Scanning electron microscopic images at high magnification reveal that normal mice have a well-defined canalicular organization around the osteocytes. In contrast, the canalicular organization of the hyp-, Cre-PhexΔflox/y, and OC-Cre-PhexΔflox/y mice was severely and comparably damaged. Original magnification, ×60 (A); ×200 (B, left panel); ×300 (B, 3 right panels); ×1,500 (C).
Figure 7
Figure 7. Serum phosphatonin levels in normal, hyp-, OC-Cre-PhexΔflox/y, and Cre-PhexΔflox/y mice.
ELISA measurements of serum FGF-23, MEPE, and sFRP-4 levels demonstrated that all 3 phosphatonins were increased in hyp- and Cre-PhexΔflox/y mice. However, serum FGF-23, but not MEPE or sFRP-4, was increased in OC-Cre-PhexΔflox/y mice. **P < 0.01, ***P < 0.001 compared with corresponding normal mice.
Figure 5
Figure 5. Bone histomorphology in normal, hyp-, Cre-PhexΔflox/y, and OC-Cre-PhexΔflox/y mice.
(A) Goldner-stained sections of cortical bone reveal at low magnification an apparent increase in unmineralized osteoid (red-brown colored) in the hyp-, Cre-PhexΔflox/y, and OC-Cre-PhexΔflox/y mice, compared with that in normals. At higher magnification, the evident increased unmineralized osteoid in the cortical bone specimens from the hyp-, Cre-PhexΔflox/y, and OC-Cre-PhexΔflox/y mice appears comparable in magnitude. (B) The double-labeled bone specimens, viewed under fluorescent light, show normal mineralization in the normal mice, manifested by distinct dual labels deposited beneath narrow osteoid seams. In contrast, the bone sections from the hyp-, Cre-PhexΔflox/y, and OC-Cre-PhexΔflox/y mice have diffuse smudged fluorescent labels under widened osteoid seams, indicating a disorderly deposition of mineral characteristic of osteomalacia. The diffuse patchy double labels were too indistinct to permit quantitative assessment of the abnormal mineralization dynamics. (C) Quantitative histological exam of the Goldner-stained sections from a minimum of 6 animals in each group revealed significantly increased osteoid surface and osteoid volume in the hyp-, Cre-PhexΔflox/y, and OC-Cre-PhexΔflox/y mice, as indicated by the asterisks denoting statistically significant values (***P < 0.001). In contrast, there was no significant difference in these values in the knockout models and the hyp-mice (denoted by the black columns), again providing evidence that the osteomalacia was of comparable magnitude in these animal models.
Figure 8
Figure 8. Real-time PCR results demonstrated the phosphatonin mRNA expression in normal, hyp-, OC-Cre-PhexΔflox/y, and Cre-PhexΔflox/y mouse bone samples.
Production of FGF-23, MEPE, and sFRP-4 was increased in hyp- and Cre-PhexΔflox/y mice. However, only FGF-23 production was increased in OC-Cre-PhexΔflox/y mice. *P < 0.05, **P < 0.01 compared with corresponding normal mice.
Figure 10
Figure 10. Removal of Neo cassette and production of global (Cre-PhexΔflox/y) knockout mice and targeted Phexflox/+Δneo mice.
(A) Pups from genotype F0 heterozygous crossing with EIIA-Cre mice were genotyped for the excision of floxed Phex. Female mosaics were mated with wild-type mice, producing variable excision of the 3 loxP sites and resulting in the Cre-PhexΔflox/y genotype (the global knockout mouse used in the study) and Phexflox/+Δneo and Phexflox/yΔneo genotypes (mice targeted for generation of Oc-Cre-PhexΔflox/y mice). (B) The PCR strategy for mouse identification is depicted.
Figure 9
Figure 9. Generation of floxed Phex locus.
Schematic structure of the targeting vector illustrates 3 loxP sites (triangles). Mutagenesis to the floxed Phex locus occurs upon 5ι and 3ι homologous recombination. Exon17 is inserted between loxP sites.

References

    1. Rasmussen, H., and Tenenhouse, H.S. 1995. Mendelian hypophosphatemias. In The metabolic and molecular basis of inherited disease. C.R. Scriver, A.L. Beaudet, W.S. Sly, and D. Valle, editors. McGraw-Hill. New York, New York, USA. 3717–3745.
    1. Holm I.A., Huang X., Kunkel L.M. Mutational analysis of the PEX gene in patients with X-linked hypophosphatemic rickets. Am. J. Hum. Genet. 1997;60:790–797. - PMC - PubMed
    1. Du L., et al. cDNA cloning of the murine Pex gene implicated in X-linked hypophosphatemia and evidence for expression in bone. Genomics. 1996;36:22–28. - PubMed
    1. Rowe P.S., et al. Distribution of mutations in the PEX gene in families with X-linked hypophosphataemic rickets (HYP). Hum. Mol. Genet. 1997;6:539–549. - PubMed
    1. Beck L., et al. Pex/PEX tissue distribution and evidence for a deletion in the 3ι region of the Pex gene in X-linked hypophosphatemic mice. . J. Clin. Invest. 1997;99:1200–1209. - PMC - PubMed

Publication types

MeSH terms