. 2008 Jun;29(8):1316-31.
doi: 10.1002/jcc.20893.

Assessment of programs for ligand binding affinity prediction

Affiliations

Assessment of programs for ligand binding affinity prediction

Ryangguk Kim et al. J Comput Chem. 2008 Jun.

Abstract

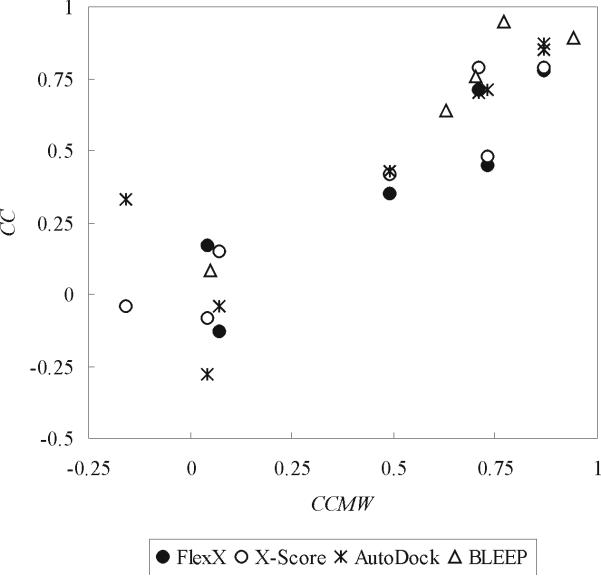
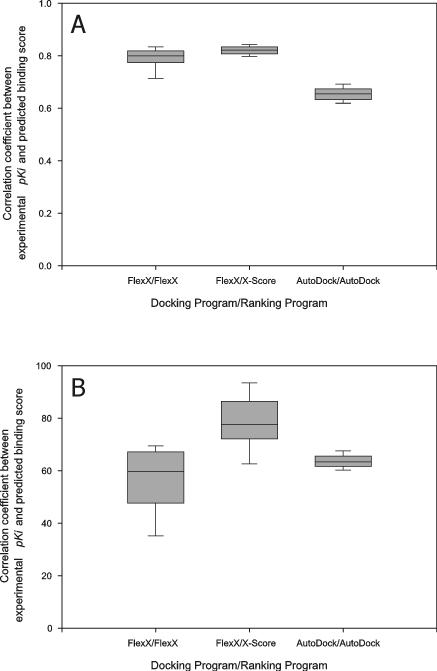
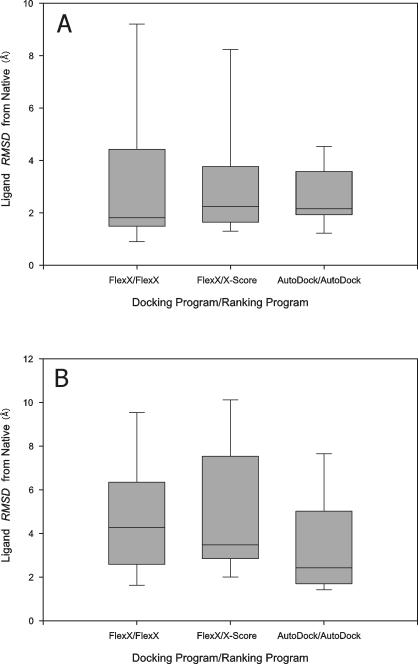
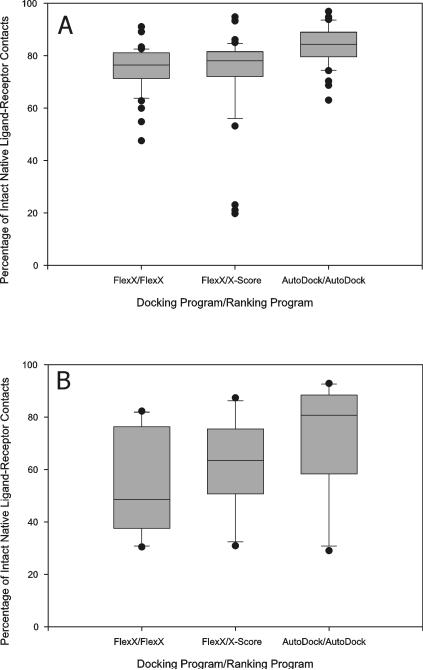
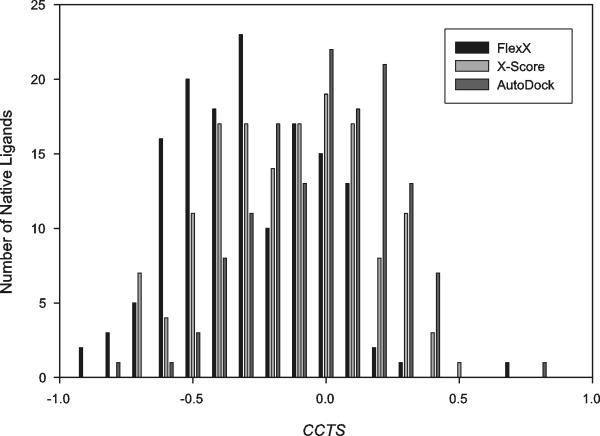
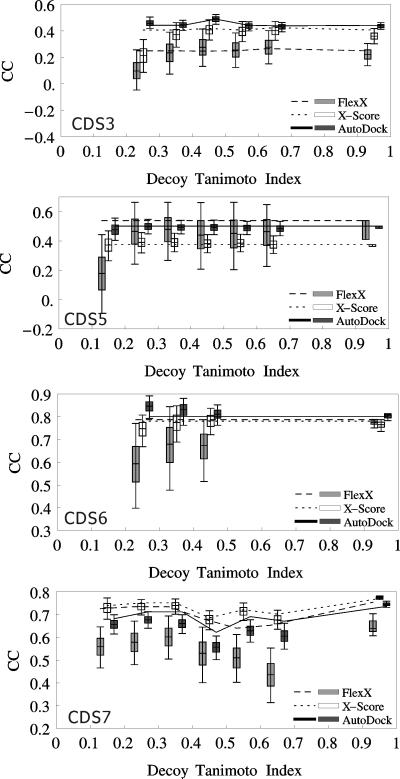
The prediction of the binding free energy between a ligand and a protein is an important component in the virtual screening and lead optimization of ligands for drug discovery. To determine the quality of current binding free energy estimation programs, we examined FlexX, X-Score, AutoDock, and BLEEP for their performance in binding free energy prediction in various situations including cocrystallized complex structures, cross docking of ligands to their non-cocrystallized receptors, docking of thermally unfolded receptor decoys to their ligands, and complex structures with "randomized" ligand decoys. In no case was there a satisfactory correlation between the experimental and estimated binding free energies over all the datasets tested. Meanwhile, a strong correlation between ligand molecular weight-binding affinity correlation and experimental predicted binding affinity correlation was found. Sometimes the programs also correctly ranked ligands' binding affinities even though native interactions between the ligands and their receptors were essentially lost because of receptor deformation or ligand randomization, and the programs could not decisively discriminate randomized ligand decoys from their native ligands; this suggested that the tested programs miss important components for the accurate capture of specific ligand binding interactions.


Figures

Figure 1
Figure 1
Correlation between CC (correlation coefficient between experimental pKd or pKi and predicted binding score) and CCMW (correlation coefficient between the logarithm of ligand molecular weight and experimental pKd or pKi). The binding scores of the native X-ray complex structures in CDS datasets were calculated with FlexX, X-Score and AutoDock. Binding scores by BLLEP and corresponding experimental pKd's or pKi's were obtained from the Protein Ligand Database. CDS1 was omitted from FlexX results since it was a significant outlier. The correlation coefficient between CC and CCMW was 0.93, 0.95, 0.85 and 0.97 for FlexX, X-Score, AutoDock and BLEEP, respectively.
Figure 2
Figure 2
Distribution of the correlation coefficient between experimental pKi and predicted binding score from cross docking. The ligands of CDS7 (A) and CDS6b (B) were docked to the receptor structures in CDS7 and CDS6b, respectively, then the “best scoring” conformations of the ligands for each receptor structure were pooled and the CC was calculated with these best scores and the experimental pKi's. This calculation of CC was repeated for each receptor, the CC's were pooled and their distribution was plotted. Box boundaries represent the 25th and 75th percentiles, and whiskers the 10th and 90th percentiles. Bars in the boxes represent median values.
Figure 3
Figure 3
The distribution of RMSD from native (ligand conformations in the X-ray complex structures) of the “best-of-best scoring” conformations of the ligands of CDS7 (A) and CDS6b (B), cross-docked to the receptor structures of CDS7 and CDS6b, respectively. Box boundaries represent the 25th and 75th percentiles, and whiskers the 10th and 90th percentiles. Bars in the boxes represent median values.
Figure 4
Figure 4
Percentage of intact native ligand-receptor contacts in “best-of-best scoring” cross docking complexes. The ligands of CDS7 (A) and CDS6b (B) were docked to the receptor structures in CDS7 and CDS6b, respectively. The “best-of-best scoring” complex was obtained for each ligand, and the contact maps of the best-of-best scoring complexes were obtained and compared to the contact maps from the native X-ray complex structures containing the same ligands, to obtain the percentages of intact native ligand-receptor contacts. Box boundaries represent the 25th and 75th percentiles, and whiskers the 10th and 90th percentiles. Dots represent outliers outside of the 5th and 95th percentiles.
Figure 5
Figure 5
The distribution of the correlation coefficients between score components and experimental pKi's. The ligands of CDS7 (A) and CDS6b (B) were cross-docked to the receptor structures of CDS7 and CDS6b, respectively, with FlexX (for Match, Lipo, Ambig, vdW, HB and HP columns) or AutoDock (for NB and EL columns) and their docked conformations ranked with FlexX (for Match, Lipo and Ambig columns), X-Score (for vdW, HB and HP columns) or AutoDock (for NB and EL columns) as described in Material and Methods. The best scoring conformations of the ligands for each receptor structure were collected and the correlation coefficient between score components and experimental pKi was calculated for each receptor and its best-scoring ligand conformations. The correlation coefficients from all the receptor structures were pooled to obtain the shown distribution. The binding score components meant the following according to the developers,,; Match: ionic, hydrogen bond and aromatic interaction score of FlexX, Lipo: lipophilic contact score of FlexX, Ambig: hydrophilic-lipophilic contact score of FlexX, vdW: van der Waals interaction score of X-Score, HB: hydrogen bond score of X-Score, HP: hydrophobic interaction score of X-Score, NB: van der Waals interaction and hydrogen bond score of AutoDock and EL: electrostatic interaction score of AutoDock.
Figure 6
Figure 6
Correlation between experimental pKi and predicted binding score from decoy receptor structure docking. The ligands of CDS7 (A) and CDS6b (B) were docked to the deformed decoys of the receptor structures of the complex structures 1oyq of CDS7 and 1tlp of CDS6b, respectively. For each ligand, the “best-of-best scoring” complex was chosen in each decoy Cα RMSD from native bin and the binding affinity estimate from this complex was used to calculate CC. The legend indicates docking/ranking programs used. Decoy RMSD of 0 Å means native receptor structures.
Figure 7
Figure 7
Percentage of intact native ligand-receptor contacts in the “best-of-best scoring” complex structures. The ligands of CDS7 (A) and CDS6b (B) were docked to the decoy receptor structures. The best-of-best scoring complex structure was obtained for each ligand in each decoy Cα RMSD from native bin. The contact map for the best-of-best scoring complex structure was compared to that of its native X-ray counterpart to obtain the percentage of intact native ligand-receptor contacts, as described in Material and Methods. The percentages were collected for each decoy Cα RMSD from native bin and plotted. The symbols and bars represent the mean values and standard deviations, respectively.
Figure 8
Figure 8
Percentage of IN decoys. Randomized decoys were prepared and their binding affinities were calculated as described in Material and Methods. For each native ligand, decoys whose predicted binding affinities were below that of the native ligand plus one kT (2.5 kJ/mol) were collected (“IN” decoys). The percentage of the IN decoys for a native ligand in a decoy Tanimoto index bin over all the IN decoys for the native ligand was calculated. The distribution of these percentages across the whole native ligands is plotted for each decoy Tanimoto index bin. Box boundaries represent the 25th and 75th percentiles, and whiskers the 5th and 95th percentiles. The bar in a box represents the average of the percentages in each decoy Tanimoto index bin.
Figure 9
Figure 9
Histogram of CCTS, the correlation coefficient between the Tanimoto indexes of the randomized decoys of a native ligand and their binding scores. Generation of the randomized decoys and evaluation of the binding scores of the decoy-receptor complexes were performed as described in Material and Methods. For each native ligand, all the Tanimoto index-binding score pairs were collected from its decoy-receptor complexes and CCTS was calculated with these pairs. A histogram was plotted with the CCTS's of all the native ligands.
Figure 10
Figure 10
Distribution of CC over 10,000 test datasets composed of randomized ligand decoy-receptor complexes in each decoy Tanimoto index bin. Generation of the randomized ligand decoys, estimation of the binding affinities of the decoy-receptor complexes and calculation of the CC in each decoy Tanimoto index bin were performed as described in Material and Methods. Box boundaries represent the 25th and 75th percentiles, and whiskers the 5th and 95th percentiles. The bar in a box represents the average of the CC's in each Tanimoto index bin. A box between decoy Tanimoto index 0.1 and 0.2 represents the distribution of CC's obtained in the Tanimoto index bin 0.1∼0.2, and so on. Lines represent the CC's obtained with the Open Babel native-like ligands that had at least one decoy in the decoy Tanimoto index bin. Gray, White and Black boxes represent the CC's obtained with FlexX, X-Score and AutoDock, respectively. Dashed, dotted and solid lines represent the CC's obtained with FlexX, X-Score and AutoDock, respectively.

References

    1. Ewing TJ, Makino S, Skillman AG, Kuntz ID. J Comput Aided Mol Des. 2001;15(5):411–428. - PubMed
    1. Jones G, et al. J Mol Biol. 1997;267(3):727–748. - PubMed
    1. Rarey M, Kramer B, Lengauer T, Klebe G. J Mol Biol. 1996;261(3):470–489. - PubMed
    1. Eldridge MD, et al. J Comput Aided Mol Des. 1997;11(5):425–445. - PubMed
    1. Bohm HJ. J Comput Aided Mol Des. 1994;8(3):243–256. - PubMed

Publication types

LinkOut - more resources