. 2008 Jan 3:8:1.
doi: 10.1186/1471-2180-8-1.

Structural and functional studies of a family of Dictyostelium discoideum developmentally regulated, prestalk genes coding for small proteins

Affiliations

Structural and functional studies of a family of Dictyostelium discoideum developmentally regulated, prestalk genes coding for small proteins

Juan J Vicente et al. BMC Microbiol. .

Abstract

Background: The social amoeba Dictyostelium discoideum executes a multicellular development program upon starvation. This morphogenetic process requires the differential regulation of a large number of genes and is coordinated by extracellular signals. The MADS-box transcription factor SrfA is required for several stages of development, including slug migration and spore terminal differentiation.

Results: Subtractive hybridization allowed the isolation of a gene, sigN (SrfA-induced gene N), that was dependent on the transcription factor SrfA for expression at the slug stage of development. Homology searches detected the existence of a large family of sigN-related genes in the Dictyostelium discoideum genome. The 13 most similar genes are grouped in two regions of chromosome 2 and have been named Group1 and Group2 sigN genes. The putative encoded proteins are 87-89 amino acids long. All these genes have a similar structure, composed of a first exon containing a 13 nucleotides long open reading frame and a second exon comprising the remaining of the putative coding region. The expression of these genes is induced at10 hours of development. Analyses of their promoter regions indicate that these genes are expressed in the prestalk region of developing structures. The addition of antibodies raised against SigN Group 2 proteins induced disintegration of multi-cellular structures at the mound stage of development.

Conclusion: A large family of genes coding for small proteins has been identified in D. discoideum. Two groups of very similar genes from this family have been shown to be specifically expressed in prestalk cells during development. Functional studies using antibodies raised against Group 2 SigN proteins indicate that these genes could play a role during multicellular development.


Figures
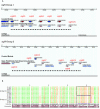
Figure 1
Figure 1
Chromosomal organization and similarity of Groups 1 and 2 sigN genes. Panel A schematically shows the location of Group 1 (upper part) and Group 2 (lower part) genes in chromosome 2. Exon coding regions are indicated as boxes and intron sequences as lines. Direction of transcription is indicated by arrowheads. Genomic fragments (contigs) where the genes are located, and the database number (curated and gene prediction) for each gene are shown in the figure. The position of exon 1 of the sigN2 gene was modified with respect to the curated model after re-sequencing of this genomic region. Dashed lines represent the genomic regions eliminated in KO strains; from bp 819699 to 829288 for Group 2, and from bp 2242478 to 2248753 for Group 1. B. Protein sequences deduced for sigN genes were compared trough the use of clustal alignments. Amino acid identity is represented as bars (conservation). Amino acids conserved in all proteins are represented in green. The more divergent regions, used to generate antibodies specific for the proteins of each group are boxed.
Figure 2
Figure 2
Phylogenetic tree of the proteins encoded by the family of sigN genes. The predicted amino acid sequences encoded by 96 genes that showed significant similarity to sigN1 were compared using the ClutalW program at the online Biology WorkBench facilities from San Diego Supercomputer Center. The alignment was used to construct a phylogenetic tree using the neighbor-joining method and 100 bootstrap trials. The number of times each branch was obtained is indicated. The number assigned to each sigN gene is shown to the right. Group 1 and Group 2 sigN genes are indicated by brackets.
Figure 3
Figure 3
Expression pattern of sigN genes during multicellular development. A. RNAs from WT and srfA- strains were collected at the indicated hours (0–30) or at the slug stage of development (slug). The coding region of the sigN1 gene was used as probe for hybridization. The mRNA detected migrated faster than the 18S rRNA. Ethidium bromide staining of the gel is shown in the lower panel. Hybridization signals were quantified by densitometry and normalized for the rRNA present in each lane (lower graphic). The value obtained for the 12 hours sample of the WT strain was considered 100% of expression. B. RNA was obtained from WT (AX4) strains, collected at the indicated hours of development. SigN genes expression was determined by RT-PCR using oligonucleotides specific for each group of genes. The sequence amplified for both groups was about 240 bp, and the control sequence, obtained by amplification of a region of the large mitochondrial ribosomal RNA, about 320 bp. Bands were quantified by densitometry, normalized in relation to the control and represented in a bar graphic, assigning 100% expression to the16 hours sample for Group 1 and 14 hours sample for Group 2.
Figure 4
Figure 4
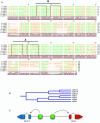
Similarity of the putative promoters regions of sigN Group 2 genes. A. The sequences of the putative promoters of sigN Group 2 genes, considered as the upstream regions from the initiation codon to the closest gene-coding region, were compared and the alignment of the regions containing putative regulatory sites is shown. The boxes in the figure indicate the possible binding sites for the transcription factor GBF (G-box Binding Factor). Pairs of contiguous binding sites have been grouped and labelled as regulatory regions A and B. Identical nucleotides are indicated in green. The level of identity between nucleotides of the different genes is represented as bars (conservation). B. Phylogenetic tree calculated from the nucleotides alignments shown in panel A using the Clustal W program. C. Schematic representation of the location of conserved, potential regulatory regions (A and B) present in the intergenic region between each pair of inverted genes, represented as rounded boxes. Coding regions are represented as boxes and intron and untranslated regions as lines. The direction of transcription of each gene is represented by arrow heads.
Figure 5
Figure 5
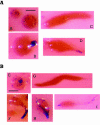
Cell-type specific activity of sigN gene promoters. A. AX-4 cells were transfected with a reporter vector driving lacZ expression under the control of the Group 1 sigN2 promoter. β-galactosidase activity, detected by X-gal staining, is shown in structures at mound (A), finger (B), slug (C) and early culminant (D) structures (Bar, 0,1 mm). B. A reporter vector where lacZ was placed under the transcriptional control of the Group 2 sigN9 promoter was transfected in AX-4 cells. X-gal staining is shown for mound (E), finger (F), slug (G), early-culminant (H) and culminant (I) structures (Bar, 0,1 mm).
Figure 6
Figure 6
Characterization of strains where sigN genes have been over-expressed, repressed by the use of interfering RNA or deleted. A. Total protein extracts were obtained from WT (AX4) and three strains (2, 4, 11) transfected with a plasmid vector for sigN4 over-expression. Group 1 antibodies were used for Western-Blot. The migration of the 10 and 15 kDa protein markers is shown on the left. B. RNA was obtained from WT and two different RNAi clones that expressed an interfering RNA based on exon 2 of sigN3 (1 and 6 clones) after 14–18 hours of development on Nitrocellulose filters. Arrows indicate the position of the endogenous mRNA (sigN mRNA) and of the RNAi transcribed from the vector (RNAi construct). Ethidium bromide staining of the gel is shown in the lower panel. C. RNA from WT (AX4) and Group 1 KO strains, harvested at the indicated hours of development (16–18 h) was analyzed by RT-PCR for expression of sigN Group 1 genes. The control band obtained by amplification of a region of the large mitochondrial ribosomal RNA (control: 320 bp long) and that corresponding to sigN Group 1 mRNA (sigN:240 bp) are indicated by arrows at the right. D. RNA was obtained from WT (AX4) and two different Group 2 KO strains (KO12, KO20) after 16 hours of development. Expression of sigN Group 2 genes was analyzed by RT-PCR. The migration of the control band (control: 320 bp) and that corresponding to sigN Group 2 mRNA (sigN: 240 bp) is indicated at the right. E. DNA from WT (AX4) and a Group 1 and Group 2 Double KO strain (Double KO) was analyzed by PCR for the presence of for sigN Group 1 genes. Migration of the amplified fragments for a control gene (control: 600 bp) and sigN Group 1 genes (410 bp) is indicated at the right.
Figure 7
Figure 7
Immunocyotchemical analyses of SigN expression. Vegetative cells (vegetative), cells obtained by dispersion of mound structures developed for 14 hours (Mound cells) or mound structures (Mounds) were fixed and stained with preimmune serum (Pre-immune) or serum raised against specific peptides (Immune) corresponding to Group 1 (upper panels) or Group 2 (lower panels) genes Alexa 568-conjugated anti-rabbit serum was used as secondary antibody. DAPI was used for nuclear staining.
Figure 8
Figure 8
Development in the presence of antibodies specific for Group 2 sigN proteins. AX4 cells were placed on nitrocellulose filters to induce multicellular development. Filters were placed over pads soaked on phosphate buffer alone (PDF) or containing preimmune serum (preimmune) or a serum raised against a Group 2-specific peptide (Anti-P2). At 15 hours of development, the antiserum filter was divided in two parts. One half was placed on a new pad soaked in PDF alone (PDF) and the other on a pad soaked in PDF containing Group 2 antiserum (Anti-P2), as shown in the lower part of the right-hand panels. Pictures were taken at the times of development indicated at the left of the panels with a stereomicroscope (Bar, 0,15 mm).

Similar articles

Cited by

References

    1. Chisholm RL, Firtel RA. Insights into morphogenesis from a simple developmental system. Nat Rev Mol Cell Biol. 2004;5:531–541. doi: 10.1038/nrm1427. - DOI - PubMed
    1. Jin T, Hereld D. Moving towards understanding eukaryotic chemotaxis. Eur J Cell Biol. 2006;85:905–913. doi: 10.1016/j.ejcb.2006.04.008. - DOI - PubMed
    1. Wilkins MR, Williams KL. The extracellular matrix of the Dictyostelium discoideum slug. Experientia. 1995;51:1189–1196. doi: 10.1007/BF01944736. - DOI - PubMed
    1. Wong EFS, Brar SK, Sesaki H, Yang CZ, Siu CH. Molecular cloning and characterization of DdCAD-1, a Ca2+- dependent cell-cell adhesion molecule, in Dictyostelium discoideum. J Biol Chem. 1996;271:16399–16408. doi: 10.1074/jbc.271.27.16399. - DOI - PubMed
    1. Noegel A, Gerisch G, Stadler J, Westphal M. Complete sequence and transcript regulation of a cell adhesion protein from aggregating Dictyostelium cells. EMBO J. 1986;5:1473–1476. - PMC - PubMed

Publication types

MeSH terms