. 2008 Jan 15;105(2):449-53.
doi: 10.1073/pnas.0708588105. Epub 2008 Jan 3.

The impact of Miocene atmospheric carbon dioxide fluctuations on climate and the evolution of terrestrial ecosystems

Affiliations

The impact of Miocene atmospheric carbon dioxide fluctuations on climate and the evolution of terrestrial ecosystems

Wolfram M Kürschner et al. Proc Natl Acad Sci U S A. .

Abstract

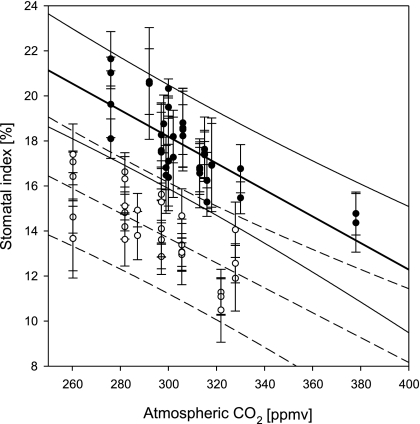
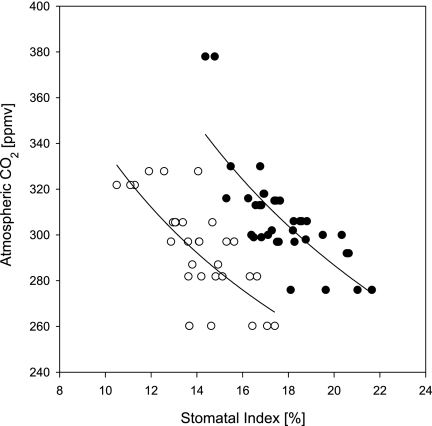
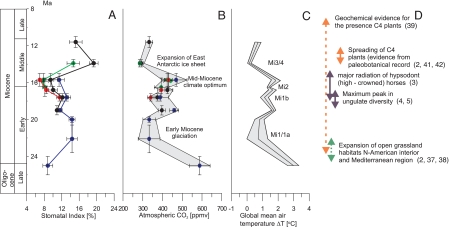
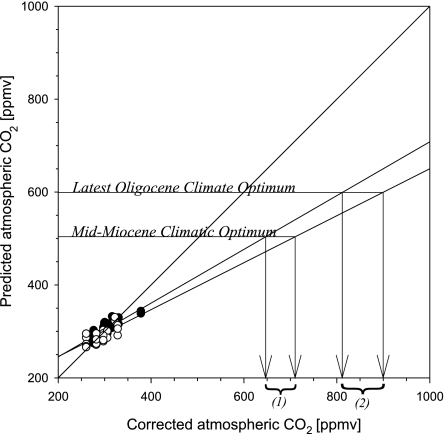
The Miocene is characterized by a series of key climatic events that led to the founding of the late Cenozoic icehouse mode and the dawn of modern biota. The processes that caused these developments, and particularly the role of atmospheric CO2 as a forcing factor, are poorly understood. Here we present a CO2 record based on stomatal frequency data from multiple tree species. Our data show striking CO2 fluctuations of approximately 600-300 parts per million by volume (ppmv). Periods of low CO2 are contemporaneous with major glaciations, whereas elevated CO2 of 500 ppmv coincides with the climatic optimum in the Miocene. Our data point to a long-term coupling between atmospheric CO2 and climate. Major changes in Miocene terrestrial ecosystems, such as the expansion of grasslands and radiations among terrestrial herbivores such as horses, can be linked to these marked fluctuations in CO2.


Conflict of interest statement

The authors declare no conflict of interest.

Figures

Fig. 1.
Fig. 1.
Training dataset of mean SI values of L. nobilis (filled circles) and O. foetens (open circles) vs. atmospheric CO2 levels with 95% prediction interval. Error bars show standard deviation.
Fig. 2.
Fig. 2.
CO2 inference model based on historical series of herbarium sheets for L. nobilis (filled circles) and O. foetens (open circles).
Fig. 3.
Fig. 3.
Late Oligocene–Miocene stomatal index records, inferred atmospheric CO2 fluctuations, and effects on global temperature compared with major events in terrestrial ecosystems. (A) SI of fossil leaf remains between 25 and 12 Ma (late Oligocene until late middle Miocene. For a list of locations and their age assessment, see SI Table 3). The lines represent trends in SI: blue, L. pseudoprinceps; black, L. nobilis; red, O. foetens; green, G. biloba. The values represent means per stratigraphic unit, with error bars indicating the standard deviation of the SI. The age error bars indicate the minimum and maximum ages of the sample. The stratigraphic framework is established by vertebrate biostratigraphy and magnetostratigraphy (see also SI Table 3). (B) Reconstructed late Oligocene–middle Miocene CO2 levels based on individual independently calibrated tree species. The error bars of the species-specific CO2 estimates are based on the standard deviation of the SI measurements on individual fossil leaf samples. The gray band indicates the envelope as determined by the minimum and maximum CO2 levels inferred from all individual samples per stratigraphic unit. (C) Modeled temperature departure of global mean surface temperature from present day, calculated from mean CO2 estimates by using a CO2–temperature sensitivity study (46). Also indicated are the major Miocene climate key events and the position of the Miocene cooling events Mi1/1a, Mi1b, Mi2, and Mi3/4 known from the marine oxygen isotope record (1). The effects of pCO2 level changes on the global mean land surface temperature were estimated assuming a radiative relationship between CO2 mixing and global air temperature inferred from climate–CO2 sensitivity models expressed as ΔT = 4ln (C/CO), where C is the mixing ratio and CO is the preindustrial CO2 mixing ratio of 278 ppmv (46). (D) Major events in the terrestrial ecosystems in response to the Miocene CO2 trends, such as changes in terrestrial herbivore communities (–5), the expansion of Miocene grasslands (2, 37, 38), and evidence for C4 biomass from paleosols (43).
Fig. 4.
Fig. 4.
Predicted CO2 concentrations calculated from Eqs. 3 and 4 for L. nobilis (filled circles) and O. foetens (open circles), plotted vs. the actual atmospheric CO2 levels with a linear extrapolation to elevated CO2. The arrows indicate the value of the corrected CO2 level for the climatic optima in the middle Miocene (1) and latest Oligocene (2).

Comment in

References

    1. Zachos JC, Pagani M, Sloan L, Thomas E, Billups K. Science. 2001;292:686–693. - PubMed
    1. Jacobs JC, Kingston JD, Jacobs LL. Ann Missouri Bot Gard. 1999;86:590–643.
    1. MacFadden BJ. In: A History of Atmospheric CO2 and its Effects on Plants, Animals, and Ecosytems. Ehleringer JR, Cerling TE, Dearing MD, editors. Vol 177. Berlin: Springer; 2005. pp. 273–292. Ecological Studies Series.
    1. Janis CM, Damuth J, Theodor JM. Proc Natl Acad Sci USA. 2000;97:7899–7904. - PMC - PubMed
    1. Janis CM, Damuth J, Theodor JM. Palaeogeogr Palaeoclimatol Palaeoecol. 2004;207:371–398.

Publication types

LinkOut - more resources