. 2008 Jan 3;15(1):29-38.
doi: 10.1101/lm.661908. Print 2008 Jan.

Removal of S6K1 and S6K2 leads to divergent alterations in learning, memory, and synaptic plasticity

Affiliations

Removal of S6K1 and S6K2 leads to divergent alterations in learning, memory, and synaptic plasticity

Marcia D Antion et al. Learn Mem. .

Abstract

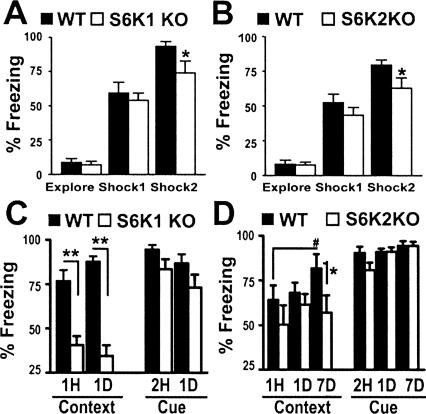
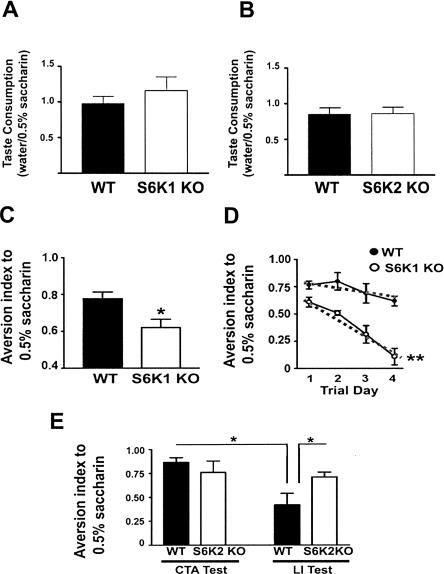
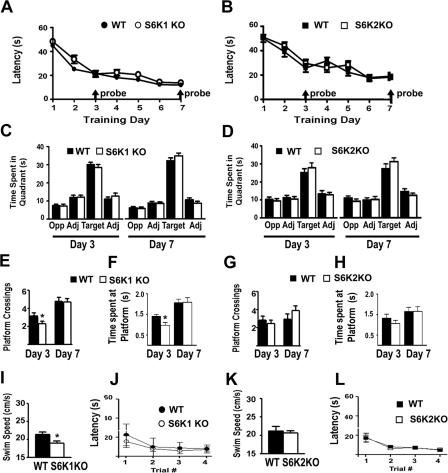
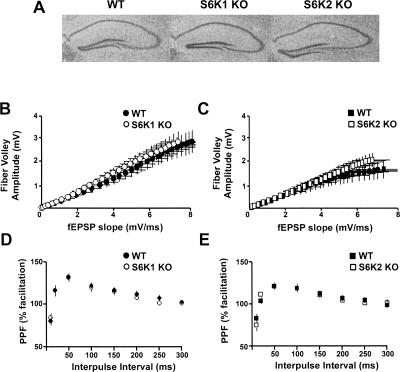
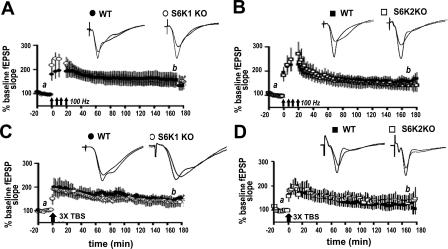
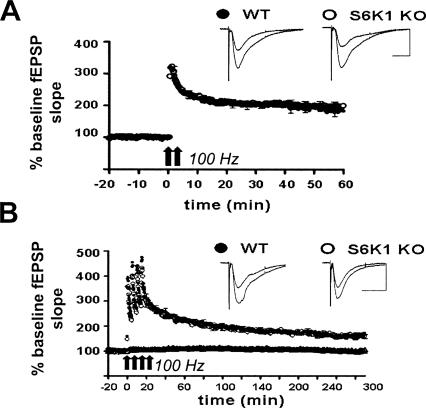
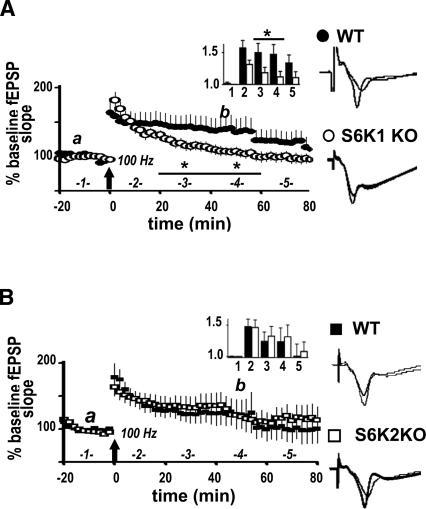
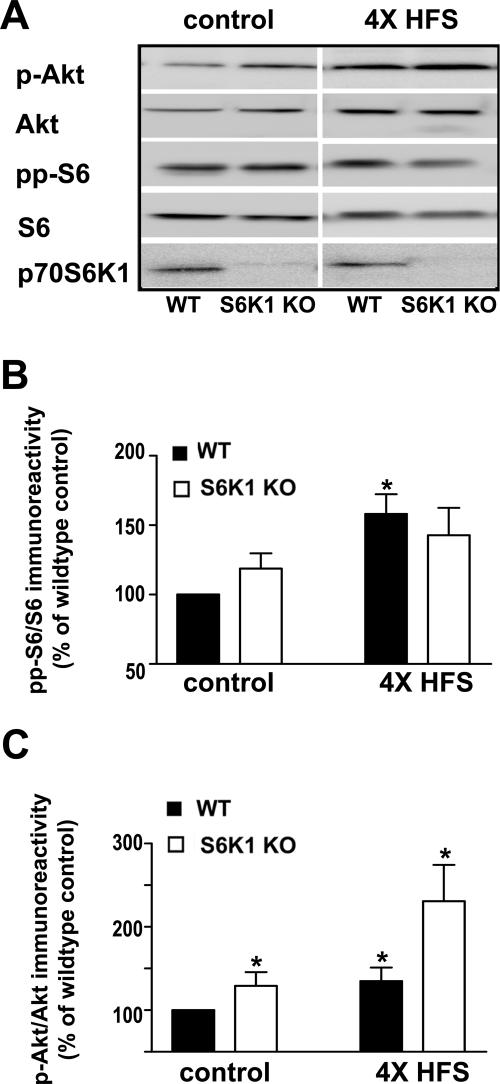
Protein synthesis is required for the expression of enduring memories and long-lasting synaptic plasticity. During cellular proliferation and growth, S6 kinases (S6Ks) are activated and coordinate the synthesis of de novo proteins. We hypothesized that protein synthesis mediated by S6Ks is critical for the manifestation of learning, memory, and synaptic plasticity. We have tested this hypothesis with genetically engineered mice deficient for either S6K1 or S6K2. We have found that S6K1-deficient mice express an early-onset contextual fear memory deficit within one hour of training, a deficit in conditioned taste aversion (CTA), impaired Morris water maze acquisition, and hypoactive exploratory behavior. In contrast, S6K2-deficient mice exhibit decreased contextual fear memory seven days after training, a reduction in latent inhibition of CTA, and normal spatial learning in the Morris water maze. Surprisingly, neither S6K1- nor S6K2-deficient mice exhibited alterations in protein synthesis-dependent late-phase long-term potentiation (L-LTP). However, removal of S6K1, but not S6K2, compromised early-phase LTP expression. Furthermore, we observed that S6K1-deficient mice have elevated basal levels of Akt phosphorylation, which is further elevated following induction of L-LTP. Taken together, our findings demonstrate that removal of S6K1 leads to a distinct array of behavioral and synaptic plasticity phenotypes that are not mirrored by the removal of S6K2. Our observations suggest that neither gene by itself is required for L-LTP but instead may be required for other types of synaptic plasticity required for cognitive processing.


Figures

Figure 1.
Figure 1.
S6K knockout mice exhibit context-specific associative fear memory deficits. (A,B) S6K1 knockout (KO) (A), S6K2 KO (B), and wild-type (WT) mice show similar behavior responses during a 3-min exposure to the training box (Explore) and 2 min after the first cue–shock pairing (Shock1). Two min after the second cue–shock pairing (Shock2), S6K1 KO and S6K2 KO mice achieve subthreshold maximal freezing behavior compared with WT mice (Shock2: S6K1 WT: 94 ± 4%, n = 24; S6K1 KO: 74 ± 9%, n = 22; S6K2 WT: 83 ± 4%, n = 31; S6K2 KO: 63 ± 7%, n = 29). (C) S6K1 KO mice show less fear memory one hour (1H) and one day (1D) following training during the context test (1H: WT = 77 ± 6%, n = 12; S6K1 KO = 41 ± 5%, n = 12; 1D: WT = 88 ± 12%, n = 12; S6K1 KO = 35 ± 6%, n = 12) and normal memory for the auditory cue. (D) S6K2 KO mice exhibit a mild deficit expressed seven days (7D) after training in the context test. This apparent deficit may reflect an improvement in the performance of WT mice that is not observed in S6K2 KO mice (1D: WT = 68 ± 6%, n = 18; S6K2 KO = 62 ± 6; 7D: WT = 82 ± 8%, n = 18; S6K2 KO = 57 ± 10%, n = 7). Normal memory was observed in S6K2 KO mice for the auditory cue. Interestingly, S6K1 and S6K2 heterozygous KO mice also exhibited contextual fear memory deficits comparable with those observed in S6K1 KO and S6K2 KO mice (data not shown). (**, P < 0.001 and *, P < 0.05 compared with WT littermate mice at the same time point. #, P < 0.05 compared with performance of WT mice at 1 h. Statistics calculated with a Student’s t-test.)
Figure 2.
Figure 2.
S6K knockout mice have deficits in taste learning. (A) The ratio of water/0.5% saccharin consumed during novel taste training was comparable between the S6K1 knockout (KO) and wild type (WT) (S6K1 KO: 1.158 ± 0.197, n = 5; WT: 0.972 ± 0.107, n = 7; t-test; P = 0.529). (B) Similarly, this ratio was not different between S6K2 KO and wild type (S6K2 KO: 0.859 ± 0.092, n = 7; WT: 0.848 ± 0.087, n = 7; t-test; P = 0.096). (C) S6K1 knockout mice show less aversion than wild-type mice to a novel taste (0.5% saccharin) that was paired with LiCl (WT = 0.78 ± 0.04, n = 5; S6K1 KO = 0.62 ± 0.05, n = 7). (D) Extinction training over four days reveals that S6K1 KO mice do not maintain taste aversion to the same degree as WT mice (coefficient of extinction: WT = -0.07 ± 0.03; S6K1 KO = -0.18 ± 0.02). However, S6K1 KO mice were able to express natural aversion to 0.04% quinine, demonstrating that gustatory responses are intact (data not shown). (E) S6K2 KO mice exhibit normal taste aversion (CTA test: WT = 0.86 ± 0.05, n = 5; S6K2 KO = 0.77 ± 0.11, n = 5). However, two pre-exposures to the novel taste prior to the CTA training session revealed that S6K2 KO mice maintain a high aversion index (latent-inhibition, LI-right) whereas WT mice do not (LI test: WT = 0.42 ± 0.10, n = 7; S6K2 KO = 0.71 ± 0.04, n = 7). (*, P < 0.05 compared with WT littermates with a Student’s t-test).
Figure 3.
Figure 3.
S6K1 knockout mice have a modest spatial learning deficit in the Morris water maze. (A,B) Training latencies are normal in S6K1 knockout (KO) (A) and S6K2 KO (B) mice. (C,D) Probe trials performed at the end of training on days three and seven indicate that the KO mice exhibit normal preference for the quadrant that contained the platform (Target) compared with the adjacent (Adj) and opposite (Opp) quadrants in S6K1 KO (C) and S6K2 KO (D) mice. Percent of time spent in target quadrant on Day 3: WT = 50 ± 2, n = 27; S6K1 KO = 47 ± 3, n = 24; WT = 42 ± 4, n = 20; S6K2 KO = 46 ± 3, n = 20. Percent of time spent in target quadrant on Day 7: WT = 57 ± 3; S6K1 KO = 60 ± 3; WT = 43 ± 4; S6K2 KO = 50 ± 3. (E) S6K1 KO mice exhibit a deficit in spatial memory for the exact location of the platform on day 3 (measured by the number of platform crossings) but normal memory by day 7. (F) S6K1 KO mice also spent less time at the location of the platform on day 3 but not on day 7. Platform crossings (number) and time spent at target location (sec), respectively, on day 3: WT = 3.2 ± 0.4 and 1.41 ± 0.09; S6K1 KO = 2.3 ± 0.3 and 0.96 ± 0.14; on day 7: WT = 4.80 ± .0.04 and 2.1 ± 0.2; S6K1 KO = 4.7 ± 0.4 and 2.1 ± 0.2. (G) S6K2 KO mice show normal spatial memory measured in platform crossings on Days 3 and 7. (H) Similarly, S6K2 KO mice spent normal time at the location of the platform during probe trials on Days 3 and 7. (I, K) S6K1 KO mice exhibit a mild impairment in swim speed during a 60-s test (88.7 ± 5.3% of WT) that is not apparent in S6K2 KO mice. (J, L) To measure visual acuity and motivation in the water maze, a visible cue was placed onto a submerged platform in a novel area of the pool and the latency to find that platform was measured over four training trials. In the visible platform version of the Morris water maze, S6K1 KO (J) and S6K2 KO (L) were able to achieve similar training latencies, demonstrating that visual acuity and motivational behavior was normal. (*, P < 0.05 compared with WT littermates).
Figure 4.
Figure 4.
Gross morphology of the hippocampus and basal measures of synaptic transmission in the Schaffer collateral pathway are normal in S6K knockout mice. (A) Nissl stains of the hippocampus revealed that WT (left), S6K1 knockout (KO) (middle), and S6K2 KO (right) have comparable hippocampal architecture. (B,C) For every slice, a stimulus was delivered at ascending intensity (0–15 V) and the amplitude of the fiber volley (the input) was measured as an indicator of the size of the ascending fiber stimulus. The initial slope (0.2–0.3 msec after the cessation of the fiber volley) of the population field excitatory postsynaptic potential (fEPSP) also was assessed as an indicator of the output. (B) Comparison of the fiber volley amplitude (input) to the evoked fEPSP slope (output) revealed a regression curve similar to one in S6K1 KO (R2 = 0.997, n = 15 slices) and WT slices (R2 = 0.999, n = 15 slices). (C) A similar finding was found in S6K2 KO (R2 = 0.999, n = 14 slices) and WT slices (R2 = 0.974, n = 14 slices). (D,E) Paired stimuli at ascending interstimulus intervals ranging from 10 to 300 msec were delivered to examine presynaptic facilitation. The amplitude of the second response of each pair was divided by the first and plotted as a function of the time between the first and second pulse. Paired-pulse facilitation was indistinguishable in hippocampal slices from S6K1 KO (D) and S6K2 KO (E) mice.
Figure 5.
Figure 5.
L-LTP is normally expressed in S6K knockout mice. (A,B) L-LTP evoked with four spaced trains of HFS is normally expressed in S6K1 knockout (KO) mice (open circles, n = 7 slices, 7 mice) compared with wild-type (WT) littermates (solid circles, 7 slices, 7 mice) (A) and in S6K2 KO mice (open squares, n = 8 slices, 8 mice) compared with WT littermates (solid squares, n = 6 slices, 6 mice) (B). (C,D) L-LTP evoked with 3 trains of θ-burst stimulation (TBS) also is normally expressed in S6K1 KO mice (open circles, n = 7 slices, 7 mice) compared with WT mice (solid circles, 5 slices, 5 mice) (C) and in S6K2 KO mice (open squares, n = 10 slices, 9 mice) compared with WT mice (solid squares, n = 10 slices, 8 mice) (D). The representative traces shown above each graph were taken 10 min before (a) and 170 min after (b) the induction of L-LTP.
Figure 6.
Figure 6.
L-LTP is normally expressed in S6K1 knockout mice. (A) L-LTP was elicited with 2 trains of 100 Hz (intertrain interval of 30 sec) and monitored 60 min after induction. No differences were observed in S6K1 knockout (KO) (open circles, n = 8 slices) and wild-type (WT) (solid circles, n = 13 slices). Scale bar, 200 msec, 0.5 mV. (B) Similarly, L-LTP evoked with 4 spaced trains of 100 Hz stimulation (intertrain interval of 5 min) revealed no observable differences up to 300 min after induction in S6K1 KO (open circles, n = 10 slices) and WT (solid circles, n = 10 slices). At the bottom of the panel, basal responses in S6K1 KO slices (open triangles, n = 10 slices) were comparable with WT (solid triangles, n = 10 slices) in unstimulated slices over a similar time course. Representative traces before and after LTP induction are exhibited to the right of each graph. Scale bar, 400 msec, 0.5 mV.
Figure 7.
Figure 7.
S6K1 knockout mice have a deficit in E-LTP. (A) One train of HFS was delivered to slices from either S6K1 KO mice or WT littermates and fEPSPs monitored 100 min after. (Inset) Data binned into columns of 20-min increments and labeled as indicated on the large graph on the x-axis and fold-increase in potentiation on the y-axis. At 20–60 min after LTP induction, S6K1 KO mice (open circles and bars, n = 11 slices from 8 mice) exhibit decreased potentiation compared with WT mice (solid circles and bars, n = 9 slices, 8 mice). Values for time points, expressed as % baseline fEPSP, are as follows: 20–40 min after HFS: WT = 150 ± 14, S6K1 KO = 118 ± 2, *P < 0.05; 40–60 min after HFS: WT = 147 ± 15, S6K1 KO = 112 ± 3, *P < 0.05. At 60–80 min after HFS, potentiation in the S6K1 KO slices returned to baseline (S6K1 KO = 110 ± 10, P > 0.05 compared with baseline), whereas potentiation in the WT slices returned to baseline 80–100 min after induction (data not displayed on graph: WT = 120 ± 11, P > 0.05 compared with baseline). (B) The same induction protocol revealed normal E-LTP in slices from S6K2 KO mice (open squares and bars, n = 9 slices, 8 mice) in comparison with WT mice (solid squares and bars, n = 8 slices, 8 mice). (A,B) Representative traces 10 min before (a), and 45 min after (b), induction are shown on the right. Statistics were calculated with a paired two-tailed Student’s t-test.
Figure 8.
Figure 8.
S6K1-deficient mice have increased basal levels of phosphorylated Akt that are further enhanced following L-LTP-inducing stimulation. Hippocampal slices from either wild-type (WT) or S6K1 knockout (S6K1 KO) mice were placed in the recording chamber and given either test pulses or L-LTP inducing stimulation (four trains of 100 Hz stimulation with a 5-min intertrain interval). Slices were removed 10 min after delivery of the stimulation (4× HFS) or after an equivalent time of receiving test pulses (control), frozen, and microdissected; and CA1 was immediately homogenized and analyzed on Western blots with the indicated antibodies. (A) Representative Western blots for Ser 473 phosphorylated Akt (p-Akt), total Akt (Akt), Ser235/Ser236 phosphorylated ribosomal protein S6 (pp-S6), total ribosomal protein S6 (S6), and the 70-kD isoform of S6K1 (p70S6K1). (B) Phosphorylated levels of S6 were significantly increased in WT slices following 4×HFS (solid bars, control = 100 ± 12% of control, 4×HFS = 158 ± 14% of control, n = 3,*P < 0.05). In contrast, a modest increase in phosphorylated levels of S6 that was not statistically significant was observed in S6K1 KO slices following 4×HFS (open bars, control = 119 ± 11%, 4×HFS = 142 ± 20% of control, n = 3, P = 0.11). Immunoreactivity of pp-S6 was normalized to total S6. Values are means ± SEM and plotted as % wild-type control. (C) Phosphorylated levels of Akt were significantly increased in WT slices following 4×HFS (solid bars, control = 100 ± 4% of control, 4×HFS = 134 ± 16% of control, n = 4, *P < 0.05). Levels of phosphorylated Akt were abnormally elevated in S6K1 KO mice in comparison with WT mice with and without L-LTP-inducing stimulation (open bars, control = 135 ± 16% of control, 4×HFS = 232 ± 48% of control, n = 4, *P < 0.05). Immunoreactivity of p-Akt was normalized to total Akt. Values are means ± SEM and plotted as % wild-type control. Statistics were calculated with one-way ANOVA with multiple comparisons on the raw data followed by a Tukey test where appropriate.

References

    1. Abel T., Nguyen P.V., Barad M., Deuel T.A., Kandel E.R., Bourtchouladze R. Genetic demonstration of a role for PKA in the late phase of LTP and in hippocampus-based long-term memory. Cell. 1997;88:615–626. - PubMed
    1. Alarcon J.M., Hodgman R., Theis M., Huang Y.S., Kandel E.R., Richter J.D. Selective modulation of some forms of Schaffer collateral-CA1 synaptic plasticity in mice with a disruption of the CPEB-1 gene. Learn. Mem. 2004;11:318–327. - PMC - PubMed
    1. Atkins C.M., Selcher J.C., Petraitis J.J., Trzaskos J.M., Sweatt J.D. The MAPK cascade is required for mammalian associative learning. Nat. Neurosci. 1998;1:602–609. - PubMed
    1. Atkins C.M., Davare M.A., Oh M.C., Derkach V., Soderling T.R. Bidirectional regulation of cytoplasmic polyadenylation element-binding protein phosphorylation by Ca2+/calmodulin-dependent protein kinase II and protein phosphatase 1 during hippocampal long-term potentiation. J. Neurosci. 2005;25:5604–5610. - PMC - PubMed
    1. Banko J.L., Poulin F., Hou L., DeMaria C.T., Sonenberg N., Klann E. The translation repressor 4E-BP2 is critical for eIF4F complex formation, synaptic plasticity, and memory in the hippocampus. J. Neurosci. 2005;25:9581–9590. - PMC - PubMed

Publication types

Substances