. 2008 Feb 8;319(5864):810-3.
doi: 10.1126/science.1153529. Epub 2008 Jan 3.

Three-dimensional super-resolution imaging by stochastic optical reconstruction microscopy

Affiliations

Three-dimensional super-resolution imaging by stochastic optical reconstruction microscopy

Bo Huang et al. Science. .

Abstract

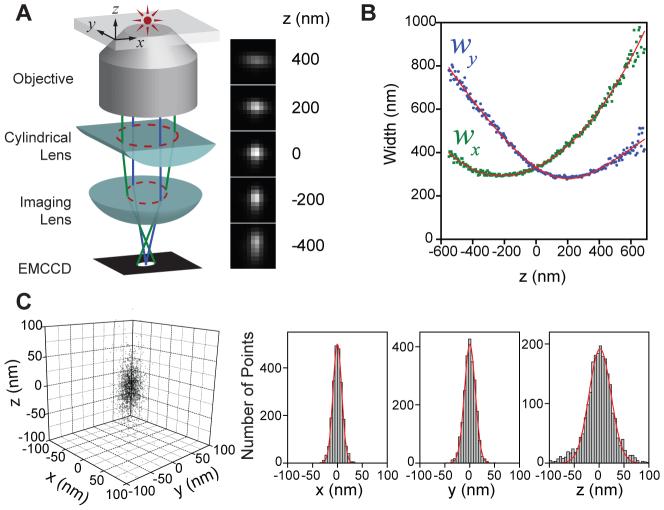
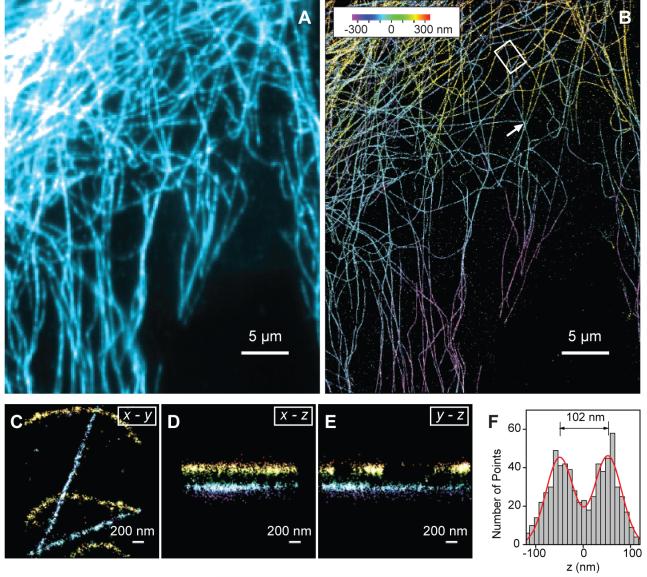
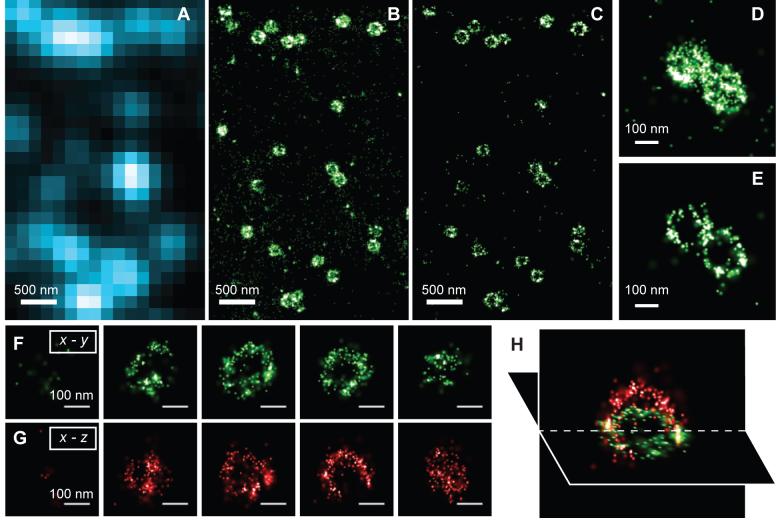
Recent advances in far-field fluorescence microscopy have led to substantial improvements in image resolution, achieving a near-molecular resolution of 20 to 30 nanometers in the two lateral dimensions. Three-dimensional (3D) nanoscale-resolution imaging, however, remains a challenge. We demonstrated 3D stochastic optical reconstruction microscopy (STORM) by using optical astigmatism to determine both axial and lateral positions of individual fluorophores with nanometer accuracy. Iterative, stochastic activation of photoswitchable probes enables high-precision 3D localization of each probe, and thus the construction of a 3D image, without scanning the sample. Using this approach, we achieved an image resolution of 20 to 30 nanometers in the lateral dimensions and 50 to 60 nanometers in the axial dimension. This development allowed us to resolve the 3D morphology of nanoscopic cellular structures.


Figures

Fig. 1
Fig. 1
The scheme of 3D STORM. (A) Three-dimensional localization of individual fluorophores. The simplified optical diagram illustrates the principle of determining the z-coordinate of a fluorescent object from the ellipticity of its image by introducing a cylindrical lens into the imaging path. The right panel shows the images of a fluorophore at various z positions. (B) The calibration curve of the image widths wx and wy as a function of z obtained from single Alexa 647 molecules. Each data point represents the average value obtained from 6 molecules. The data were fit to a defocusing function (red curve) as described in the Supporting Online Materials (27). (C) Three-dimensional localization distribution of single molecules. Each molecule gives a cluster of localizations due to repetitive activation of the same molecule. Localizations from 145 clusters were aligned by their center-of-mass to generate the overall 3D presentation of the localization distribution (left panel). Histograms of the distribution in x, y and z (right panels) were fit to a Gaussian function, yielding the standard deviation of 9 nm in x, 11 nm in y, and 22 nm in z.
Fig. 2
Fig. 2
Three-dimensional STORM imaging of microtubules in a cell. (A) Conventional indirect immunofluorescence image of microtubules in a large area of a BS-C-1 cell. (B) The 3D STORM image of the same area with the z-position information color-coded according to the colored scale bar. Each localization is depicted in the STORM image as a Gaussian peak, the width of which is determined by the number of photons detected (5). (C-E) The x-y, x-z and y-z cross-sections of a small region of the cell outlined by the white box in (B), showing 5 microtubule filaments. Movie S1 shows the 3D representation of this region, with the viewing angle rotated to show different perspectives (27). (F) The z profile of two microtubules crossing in the x-y projection but separated by 102 nm in z, from a region indicated by the arrow in (B). The histogram shows the distribution of z-coordinates of the localizations, fit to two Gaussians with identical widths (FWHM = 66 nm) and a separation of 102 nm (red curve). The apparent width of 66 nm agrees quantitatively with the convolution of our imaging resolution in z (represented by a Gaussian function with FWHM of 55 nm) and the previously measured width of antibody-coated microtubules (represented by a uniform distribution with a width of 56 nm) (5).
Fig. 3
Fig. 3
Three-dimensional STORM imaging of clathrin-coated pits in a cell. (A) Conventional direct immunofluorescence image of clathrin in a region of a BS-C-1 cell. (B) The 2D STORM image of the same area with all localizations at different z positions included. (C) A x-y cross-section (50 nm thick in z) of the same area showing the ring-like structure of the periphery of the CCPs at the plasma membrane. (D, E) Magnified view of two nearby CCPs in 2D STORM (D) and their 100 nm thick x-y cross-section in the 3D image (E). (F - H) Serial x-y cross-sections (each 50 nm thick in z) (F) and x-z cross-sections (each 50 nm thick in y) (G) of a CCP, and an x-y and x-z cross section presented in 3D perspective (H), showing the cage like structure of the pit.

References

    1. Hell SW. Nat. Biotech. 2003;21:1347. - PubMed
    1. Hell SW. Science. 2007;316:1153. - PubMed
    1. Gustafsson MGL. Proc. Natl. Acad. Sci., USA. 2005;102:13081. - PMC - PubMed
    1. Rust MJ, Bates M, Zhuang X. Nat. Meth. 2006;3:793. - PMC - PubMed
    1. Bates M, Huang B, Dempsey GT, Zhuang X. Science. 2007;317:1749. - PMC - PubMed

Publication types

MeSH terms