

Auditory-visual speech perception in normal-hearing and cochlear-implant listeners
- PMID: 18177171
- PMCID: PMC2662523
- DOI: 10.1121/1.2816573
Auditory-visual speech perception in normal-hearing and cochlear-implant listeners
Abstract
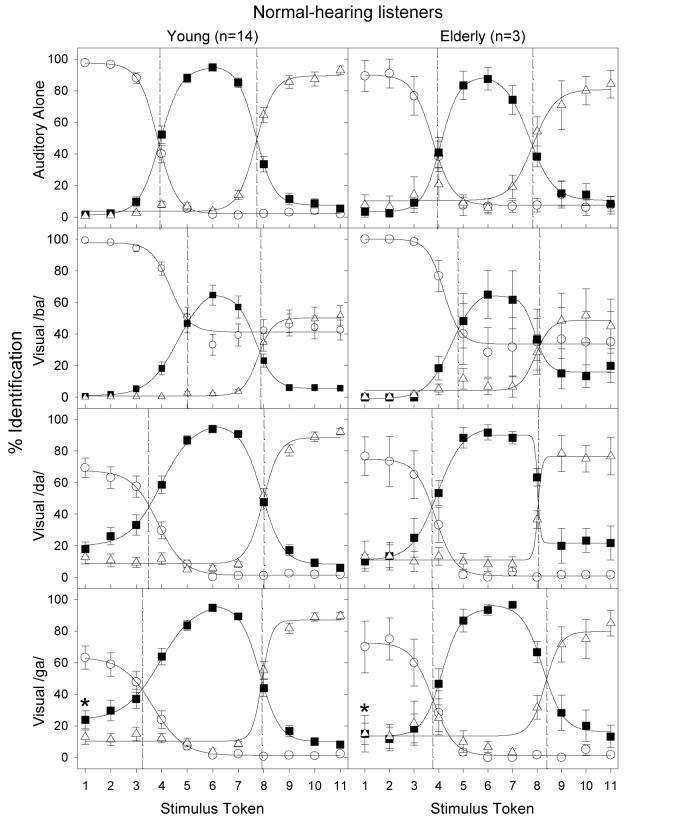
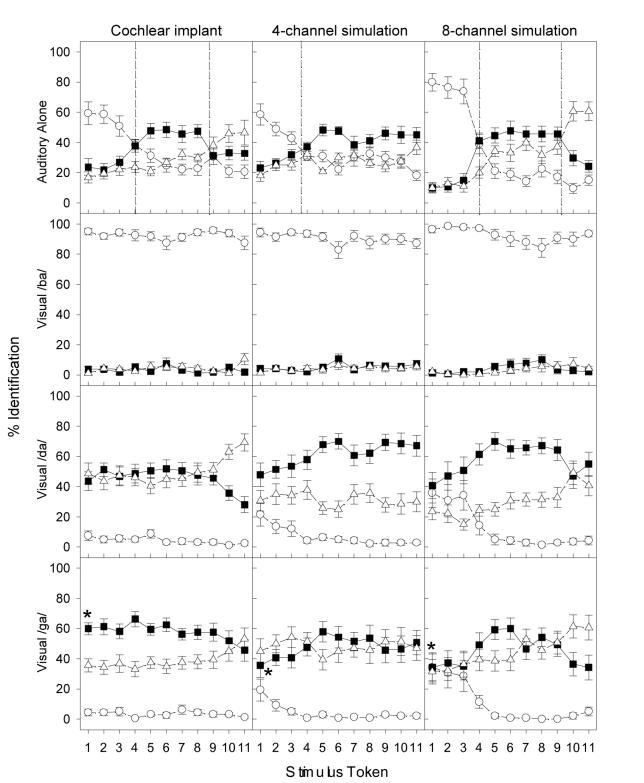
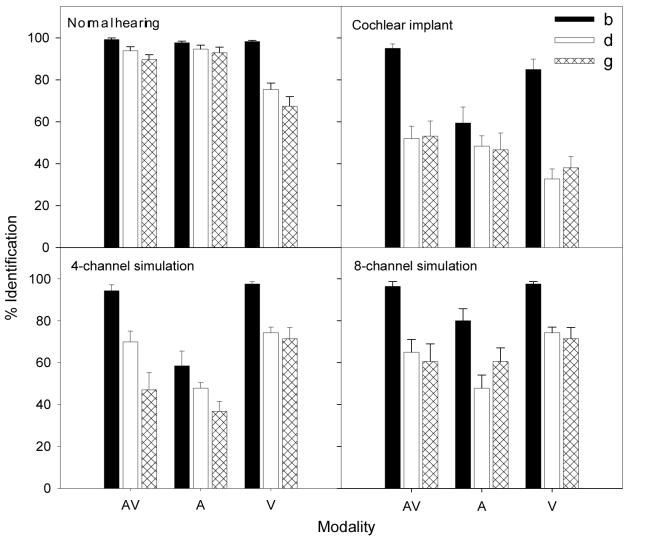
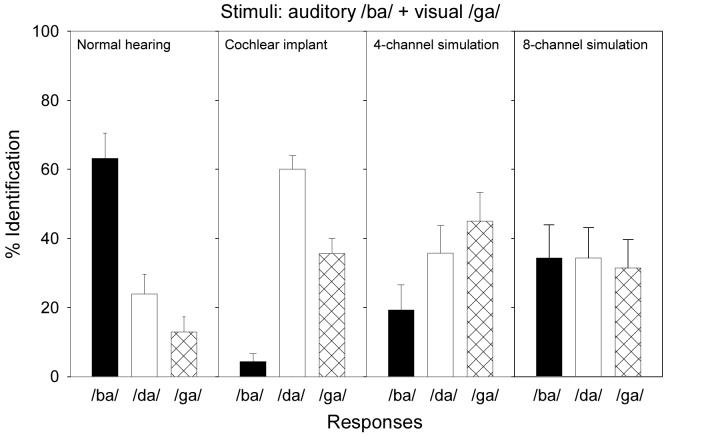
The present study evaluated auditory-visual speech perception in cochlear-implant users as well as normal-hearing and simulated-implant controls to delineate relative contributions of sensory experience and cues. Auditory-only, visual-only, or auditory-visual speech perception was examined in the context of categorical perception, in which an animated face mouthing ba, da, or ga was paired with synthesized phonemes from an 11-token auditory continuum. A three-alternative, forced-choice method was used to yield percent identification scores. Normal-hearing listeners showed sharp phoneme boundaries and strong reliance on the auditory cue, whereas actual and simulated implant listeners showed much weaker categorical perception but stronger dependence on the visual cue. The implant users were able to integrate both congruent and incongruent acoustic and optical cues to derive relatively weak but significant auditory-visual integration. This auditory-visual integration was correlated with the duration of the implant experience but not the duration of deafness. Compared with the actual implant performance, acoustic simulations of the cochlear implant could predict the auditory-only performance but not the auditory-visual integration. These results suggest that both altered sensory experience and improvised acoustic cues contribute to the auditory-visual speech perception in cochlear-implant users.
Figures
References
-
- Barnard E, Bertrant J, Rundlem B, Cole R, al. e. 2000. http://cslu.cse.ogi.edu/, Oregon Graduate Institute of Science and Technology (October 16, 2007)
-
- Bernstein LE, Auer ET, Jr., Moore JK, Ponton CW, Don M, Singh M. Visual speech perception without primary auditory cortex activation. Neuroreport. 2002;13:311–315. - PubMed
-
- Bernstein LE, Demorest ME, Tucker PE. Speech perception without hearing. Perception & Psychophysics. 2000;62:233–252. - PubMed
-
- Binnie CA, Montgomery AA, Jackson PL. Auditory and visual contributions to the perception of consonants. Journal of Speech and Hearing Research. 1974;17:619–630. - PubMed
Publication types
MeSH terms
Grants and funding
LinkOut - more resources
Full Text Sources
Medical