. 2008 Mar 7;283(10):6241-52.
doi: 10.1074/jbc.M706624200. Epub 2008 Jan 3.

Epidermal growth factor receptor and protein kinase C signaling to ERK2: spatiotemporal regulation of ERK2 by dual specificity phosphatases

Affiliations

Epidermal growth factor receptor and protein kinase C signaling to ERK2: spatiotemporal regulation of ERK2 by dual specificity phosphatases

Christopher J Caunt et al. J Biol Chem. .

Abstract

Spatiotemporal aspects of ERK activation are stimulus-specific and dictate cellular consequences. They are dependent upon dual specificity phosphatases (DUSPs) that bind ERK via docking domains and can both inactivate and anchor ERK in cellular compartments. Using high throughput fluorescence microscopy in combination with a system where endogenous ERKs are removed and replaced with wild-type or mutated ERK2-green fluorescent protein (GFP), we show that ERK2 activation responses to epidermal growth factor (EGF) and protein kinase C (PKC) are transient and sustained, respectively. PKC-mediated ERK2 activation is associated with prolonged nuclear localization in the dephosphorylated form, whereas EGF-stimulated ERK2 activation mediates only transient nuclear accumulation. By using short inhibitory RNAs to nuclear inducible DUSP1, -2, or -4 (alone or in combination), we demonstrate that all three of these enzymes contribute to the dephosphorylation of PKC (but not EGF)-activated ERK2 in the nucleus but that they have opposing effects on localization. DUSP2 and -4 inactivate and anchor ERK2, whereas DUSP1 dephosphorylates ERK in the nucleus but allows its traffic back to the cytoplasm. Overexpression of DUSP1, -2, or -4 prevented ERK2 activation, but only DUSP2 and -4 caused ERK2-GFP nuclear accumulation or could be immunoprecipitated with ERK2. Furthermore, protein synthesis inhibition or replacement of wild-type ERK2-GFP with docking domain mutants selectively increased PKC effects on ERK activity and altered ERK2-GFP localization. These mutations also impaired the ability of ERK2-GFP to bind DUSP2 and -4. Together, our data reveal a novel, stimulus-specific, and phosphatase-specific mechanism of ERK2 regulation in the nucleus by DUSP1, -2, and -4.


Figures
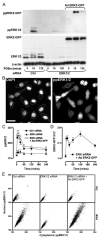
FIGURE 1
FIGURE 1. A knockdown and add-back model for studying ERK regulation
A, cells were transfected with control siRNAs (ctrl), ERK1/2 siRNAs, or ERK1/2 siRNAs and transduced with Ad ERK2-GFP, prior to stimulation with 1 μm PDBu as indicated. Samples were immunoblotted for total ERK1/2 (middle panel) and ppERK1/2 (top panel). Immunoblotting for β-actin (bottom panel) was used as a loading control. ERK1/2 and ppERK1/2 labels denote total or phosphorylated ERK1/2 (44/42 kDa, respectively). ERK2-GFP and ppERK2-GFP labels denote total and phosphorylated bands of ERK2-GFP (69 kDa), respectively. Data shown are representative of three independent experiments showing similar data. B, images of cells transfected in 96-well plates as described for control samples in A prior to 1 μm PDBu stimulation (15 min), staining, and automated image acquisition. Bar, 20 μm. Outlines denote the segmentation of cells according to DAPI and ppERK1/2 staining using IN Cell Analyzer software. C, cells were transfected with control siRNAs (filled circles), ERK1/2 siRNAs (filled triangles), or ERK1/2 siRNAs as well as Ad ERK2-GFP (open circles) and stimulated with 1 μm PDBu for the times indicated. Cells were fixed and stained with DAPI and for ppERK1/2 prior to image acquisition in duplicate wells. The graph shows average ppERK1/2 signal intensity (whole cells) from four independent experiments (mean ± S.E., n = 4). D, cells imaged for ppERK intensity in C were simultaneously imaged and analyzed for ERK2-GFP intensity in nuclear and cytoplasmic compartments. These values were used to calculate the N:C ERK2-GFP ratio for each cell, and the data were pooled from four separate experiments (mean ± S.E., n = 4). E, scatterplots showing nuclear versus cytoplasmic intensity values from cells transfected as indicated and incubated with or without 1 μm PDBu for 15 min. Each dot represents a single cell, and data were acquired from four images in two separate experiments.
FIGURE 2
FIGURE 2. Spatiotemporal characteristics of EGF- and PDBu-stimulated ERK regulation
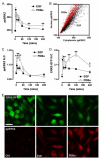
Cells were transfected in 96-well plates with ERK1/2 siRNAs and transduced with Ad ERK2-GFP prior to stimulation with 10 nm EGF or 1 μm PDBu for the times indicated. Cells were fixed and stained before image acquisition and analysis (as described under Fig. 1) for the calculation of whole-cell ppERK2 intensity (A), the N:C ppERK2 ratio (C), and the N:C ERK2-GFP ratio (D). The scatterplot (B) shows the relationship between nuclear and cytoplasmic ppERK2 staining for individual cells stimulated with EGF or PDBu, as indicated, for 5 min. E, representative images of cells in the ERK2-GFP expression range used in analysis are shown of unstimulated cells (Ctrl) or cells treated with 10 nm EGF (5 min) or 1 μm PDBu (15 min) as indicated for fields acquired from ERK2-GFP and ppERK2 signals. Bar, 20 μm. Data shown in A, C, and D were acquired from seven separate experiments, each with duplicate wells (mean ± S.E., n = 7). Each individual experiment included internal control cells transfected with control GFP siRNAs or ERK1/2 siRNAs without addition of Ad ERK2-GFP. In all cases, the ppERK1/2 signal was inhibited >95% by ERK1/2 siRNAs and was recovered by Ad ERK2-GFP transduction at all time points of stimulation by all stimuli (not shown). For figures A, C, and D, * = p < 0.05 and ** = p < 0.01, comparing EGF with PDBu-treated cells using two-way ANOVA and Bonferroni post hoc tests.
FIGURE 3
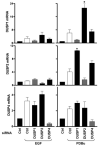
FIGURE 3. Stimulus-specific and ERK-dependent regulation of nuclear inducible DUSP mRNA
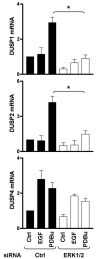
Cells were transfected in 6-well plates with control siRNAs (Ctrl) or ERK1/2 siRNAs prior to stimulation for 120 min with 10 nm EGF or 1 μm PDBu, as indicated. Total RNA isolates were analyzed for relative levels of DUSP1, -2, or -4 mRNA using qPCR as described under “Experimental Procedures.” Data are expressed as average normalized values obtained from three separate experiments, each with duplicate readings (mean ± S.E., n = 3). * = p < 0.05, comparing control siRNA-transfected cells to ERK1/2 siRNA-transfected cells, using Student's t test.
FIGURE 4
FIGURE 4. Stimulus-specific effects of nuclear inducible DUSP siRNAs alone and in combination
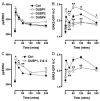
A and B, cells were transfected in 96-well plates with ERK1/2 siRNAs alongside control (Ctrl) or individual DUSP1, -2, or -4 siRNA SMARTpools as indicated, prior to transduction with ERK2-GFP. For triple knockdowns (C and D), cells were transfected with ERK1/2 siRNAs and DUSP1, -2, and -4 siRNA SMARTpools in combination (as indicated) before addition of Ad ERK2-GFP. Cells were stimulated with 1 μm PDBu (circles) for the times indicated, prior to staining and imaging (as described under Fig. 1). Data obtained from control siRNA-transfected cells are included in all plots for clarity. Data shown are ppERK2 intensity values (A and C) and N:C ERK2-GFP ratios (B and D) from four separate experiments (mean ± S.E., n = 4). * = p < 0.05 and ** = p < 0.01, comparing control siRNA-transfected cells to DUSP siRNA-transfected cells using two-way ANOVA and Bonferroni post hoc tests.
FIGURE 5
FIGURE 5. Differential binding and nuclear accumulation of ERK2-GFP by Myc-tagged DUSPs
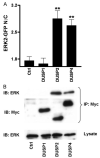
A, cells were transfected in 96-well plates with ERK1/2 siRNAs prior to being simultaneously transduced with Ad ERK2-GFP and transfected with pCR3.1 (Ctrl), or Myc-tagged DUSP1, DUSP2, or DUSP4 constructs as indicated, prior to fixation and staining with anti-Myc antibodies as described under “Experimental Procedures.” Cells expressing comparable levels of Myc-tagged DUSP1, -2, and -4 were compared with control cells in four independent experiments (mean ± S.E., n = 4). ** = p < 0.01, comparing control (ctrl) cells to Myc-DUSP-transfected cells using one-way ANOVA and Dunnet's post hoc test. B, cells were transfected as above in 9-cm plates with ERK1/2 siRNAs prior to being simultaneously transduced with Ad ERK2-GFP and transfected with pCR3.1 (Ctrl), or Myc-tagged DUSP1, DUSP, or DUSP4 constructs as indicated. Cells were lysed and immunoprecipitated with immobilized anti-Myc as described under “Experimental Procedures.” Representative immunoblots for Myc (IB: Myc) and for ERK (IB: ERK) from anti-Myc immunoprecipitates (IP: Myc) and whole cell lysates (lysate) are shown from four independent experiments showing similar data.
FIGURE 6
FIGURE 6. Regulation of DUSP transcription by DUSP siRNAs
Cells were transfected in 6-well plates with ERK1/2 siRNAs and 10 nm control (Ctrl) or individual DUSP1, -2, or -4 siRNAs (as indicated) before addition of Ad ERK2-GFP and stimulation with 10 nm EGF or 1 μm PDBu as indicated for 120 min. Total RNA isolates were analyzed for relative levels of DUSP1, -2, or -4 mRNA using qPCR protocols as described under “Experimental Procedures.” Data are expressed as average normalized values obtained from three separate experiments, each with duplicate readings (mean ± S.E., n = 3). * = p < 0.05 comparing control siRNA-transfected cells to DUSP siRNA-transfected cells stimulated with the same ligand, using Student's t test.
FIGURE 7
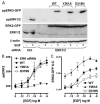
FIGURE 7. Influence of docking domains on ERK signaling
Cells transfected with control siRNAs (Ctrl) or ERK1/2 siRNAs were transduced with Ad WT or Y261A or D319N-mutated ERK2-GFP and analyzed for activation and localization as follows. A, cells were harvested following stimulation with (+) or without (−) 10 nm EGF (5 min). ERK1/2 protein levels and ppERK1/2 activation were assessed by immunoblotting with anti-ERK1/2 (middle panel) and anti-ppERK1/2, respectively. Immunoblotting for β-actin (bottom panel) was used as a loading control. Data shown are representative of three independent experiments showing similar data. B and C, cells were stimulated in 96-well plates with the indicated concentrations of EGF for 5 min and stained before image acquisition and analysis (as described under Fig. 1) for the calculation of whole-cell ppERK2 intensity (B), and the N:C ERK2-GFP ratio (C). Data shown in B and C are pooled from three independent experiments, each performed in triplicate (mean ± S.E., n = 3).
FIGURE 8
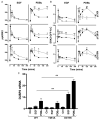
FIGURE 8. Effects of CHX and docking domain mutation on ERK2-GFP distribution and induction of DUSP mRNA
A and B, cells were transfected in 96-well plates with ERK1/2 siRNAs and transduced with either Ad WT ERK2-GFP, Y261A-mutated ERK2-GFP (Y261A, or D319N-mutated ERK2-GFP (D319N). Cells represented in the top panels were treated with 30 μm CHX for 30 min before all cells were stimulated with 10 nm EGF or 1 μm PDBu as indicated in internally controlled experiments. Data obtained from stimulated WT ERK2-GFP transduced cells are included in all graphs (closed circles) showing comparison with simultaneous CHX treatment (top panels), Y261A mutation (middle panels), and D319N mutation (bottom panels) for clarity (each test condition is represented by open circles). Data shown are ppERK2 intensity (A) and ERK2-GFP N:C ratios (B) obtained from five separate experiments, each with duplicate wells (mean ± S.E., n = 3–5). * = p < 0.05 and ** = p < 0.01, comparing WT to CHX, Y261A, or D319N conditions, according to two-way ANOVA and Bonferroni post hoc tests. C, cells were transfected in 6-well plates with control siRNAs (Ctrl) or ERK1/2 siRNAs and transduced with Ad WT or Y261A or D319N-mutated ERK2-GFP prior to stimulation with 10 nm EGF or 1 μm PDBu as indicated for 120 min. Total RNA isolates were analyzed for relative levels of DUSP2 mRNA using qPCR protocols described under “Experimental Procedures.” Data shown are normalized values obtained from three separate experiments, each with duplicate readings (mean ± S.E., n = 3). ** = p < 0.01, comparing WT ERK2-GFP expressing cells with D319N ERK2-GFP expressing cells, using Student's t test.
FIGURE 9
FIGURE 9. Docking domain dependence of binding and nuclear accumulation of ERK2-GFP by Myc-tagged DUSPs
A, cells were transfected in 9-cm plates with ERK1/2 siRNAs prior to being simultaneously transduced with either Ad WT ERK2-GFP, Y261A-mutated ERK2-GFP (Y261A), or D319N-mutated ERK2-GFP (D319N) and transfected with pCR3.1 (Ctrl) or Myc-tagged DUSP1, DUSP2, or DUSP4 constructs as indicated. Cells were lysed and immunoprecipitated with immobilized anti-Myc as described under “Experimental Procedures.” Representative immunoblots for Myc (IB: Myc) and for ERK (IB: ERK) from anti-Myc immunoprecipitates (IP: Myc) and whole cell lysates (lysate) are shown from two independent experiments showing similar data. B, cells were transfected in 96-well plates with ERK1/2 siRNAs prior to being simultaneously transduced with either Ad WT ERK2-GFP, Y261A-mutated ERK2-GFP (Y261A), or D319N-mutated ERK2-GFP (D319N) and transfected with pCR3.1 (Ctrl) or Myc-tagged DUSP1, DUSP2, or DUSP4 constructs as indicated, prior to fixation and staining with anti-Myc antibodies as described under “Experimental Procedures.” Cells expressing comparable levels of Myc-tagged DUSP1, -2, and -4 were compared with control cells in four independent experiments (mean ± S.E., n = 6). ** = p < 0.01, comparing control cells to Myc-DUSP-transfected cells using one-way ANOVA and Dunnet's post hoc test.
FIGURE 10
FIGURE 10. Model of nuclear ERK dephosphorylation and traffic during sustained ERK responses
Phosphorylation by MEK in the cytoplasm causes translocation of nontethered phosphorylated ERK to the nucleus. Our data suggest that DUSP1, -2, and -4 transcription is induced, and each protein contributes to the dephosphorylation of ERK whereas DUSP1 releases it. Thus DUSP2 and -4 expression causes nuclear accumulation of ERK as a negative feedback mechanism, whereas DUSP1 allows it to return to the cytosol for reactivation.

Similar articles

Cited by

References

    1. Caunt CJ, Finch AR, Sedgley KR, McArdle CA. Trends Endocrinol. Metab. 2006;17:276–283. - PubMed
    1. Ebisuya M, Kondoh K, Nishida E. J. Cell Sci. 2005;118:2997–3002. - PubMed
    1. Murphy LO, Blenis J. Trends Biochem. Sci. 2006;31:268–275. - PubMed
    1. Murphy LO, Smith S, Chen RH, Fingar DC, Blenis J. Nat. Cell Biol. 2002;4:556–564. - PubMed
    1. Yamamoto T, Ebisuya M, Ashida F, Okamoto K, Yonehara S, Nishida E. Curr. Biol. 2006;16:1171–1182. - PubMed

Publication types

MeSH terms

Substances