. 2008 Apr 15;17(8):1063-75.
doi: 10.1093/hmg/ddm379. Epub 2008 Jan 4.

Neuronal SMN expression corrects spinal muscular atrophy in severe SMA mice while muscle-specific SMN expression has no phenotypic effect

Affiliations

Neuronal SMN expression corrects spinal muscular atrophy in severe SMA mice while muscle-specific SMN expression has no phenotypic effect

Tatiana O Gavrilina et al. Hum Mol Genet. .

Abstract

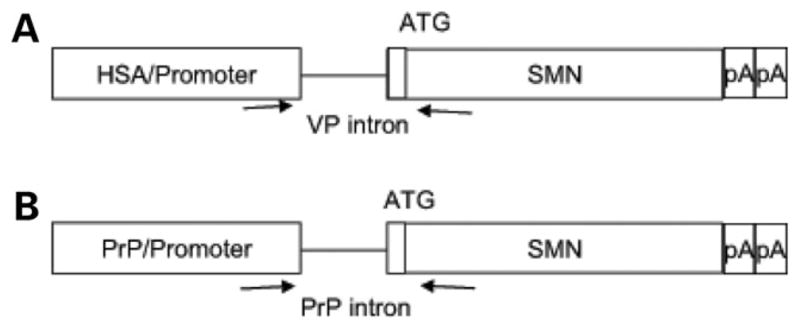
Spinal muscular atrophy (SMA) is caused by loss of the survival motor neuron gene (SMN1) and retention of the SMN2 gene. The copy number of SMN2 affects the amount of SMN protein produced and the severity of the SMA phenotype. While loss of mouse Smn is embryonic lethal, two copies of SMN2 prevents this embryonic lethality resulting in a mouse with severe SMA that dies 5 days after birth. Here we show that expression of full-length SMN under the prion promoter (PrP) rescues severe SMA mice. The PrP results in high levels of SMN in neurons at embryonic day 15. Mice homozygous for PrP-SMN with two copies of SMN2 and lacking mouse Smn survive for an average of 210 days and lumbar motor neuron root counts in these mice were normal. Expression of SMN solely in skeletal muscle using the human skeletal actin (HSA) promoter resulted in no improvement of the SMA phenotype or extension of survival. One HSA line displaying nerve expression of SMN did affect the SMA phenotype with mice living for an average of 160 days. Thus, we conclude that expression of full-length SMN in neurons can correct the severe SMA phenotype in mice. Furthermore, a small increase of SMN in neurons has a substantial impact on survival of SMA mice while high SMN levels in mature skeletal muscle alone has no impact.


Conflict of interest statement

Conflict of Interest statement. None declared.

Figures

Figure 1
Figure 1
Diagram of expression constructs used to create transgenes. PrP is the prion promoter (48) and HSA is the human skeletal actin promoter (45). The arrows indicate the position of primers used to specifically amplify SMN produced by these constructs by RT–PCR.
Figure 2
Figure 2
Expression analysis of HSA-SMN and PrP-SMN SMA mice in 5-day-old animals. Western blot analysis of SMN expression in (A) brain, (B) spinal cord, (C) heart and (D) muscle and (E) liver tissue of HSA-SMN SMA and PrP-SMN SMA mice. All PrP-SMN and HSA-SMN SMA mice are homozygous for the PrP-SMN or HSA-SMN transgene and contain two copies of SMN2. HCSMN2 is line 566 that when homozygous contains 16 copies of SMN2 (21). The HSA63-SMN sample in (C) and (D) has 10 times less protein to avoid overloading of SMN. The HSA69-SMN sample in (D) has 10 times less protein loaded as well. (F) Real-time PCR analysis of SMN expression in adult mice homozygous for the PrP92-SMN transgene using human SMN specific primers. The total amount of SMN mRNA is first determined in each tissue relative to actin mRNA. The relative SMN mRNA produced in each tissue is shown relative to the total amount of SMN produced by two copies of SMN2 to give a fold-increase of SMN above what is produced by SMN2. (Note: the total SMN2 mRNA production not the amount of full-length SMN is shown). Error bars are standard deviation.
Figure 3
Figure 3
Expression analysis of PrP92-SMN in embryonic tissue of SMA mice. (A and B) Western blot analysis of SMN in spinal cord tissue of PrP92-SMN SMA mice (SMN2+/+; Smn−//−; PrP92-SMN+/+) at embryonic day 13 (e13) and e15 respectively. (C and D) Western blot analysis of SMN in brain tissue of PrP92-SMN SMA mice (SMN2+/+; Smn−/−; PrP92-SMN+/+) at e13 and e15, respectively. Duplicate samples of the same genotype from two different mice are found on each gel. (E) Quantification of SMN in spinal cord. The western blot SMN band intensity relative to actin is determined. The amount of SMN in PrP92-SMN SMA mice (SMN2+/+; Smn−/−; PrP92-SMN+/+) is expressed relative to the amount of SMN in a SMA mouse lacking the PrP92-SMN transgene (SMN2+/+; Smn−/−) as a fold-increase. The total sample number in each group is four.
Figure 4
Figure 4
Survival analysis and phenotype of SMA mice expressing HSA-SMN or PrP-SMN. (A) Kaplan–Meier survival curves of SMA mice containing HSA-SMN or PrP-SMN showing minimal or no correction of lifespan. Blue line: SMN2+/+; Smn−/−; HSA63-SMN+/− have a mean survival of 6.6 ± 0.8 days (n = 29). Orange line: SMN2+/+; Smn−/−; HSA69-SMN+/+ mice showing an average survival of 3.5 ± 0.5 days (n = 15 mice). Red line: SMN2+/+; Smn−/−; PrP13-SMN+/− mice survived 7.0 ± 0.7 days (n = 36). Black line: SMN2+/+; Smn−/−; PrP90-SMN+/− mice survived 7.5 ± 0.7 days (n = 17). Yellow line: SMA mice SMN2+/+; Smn−/− survived an average of 4.6 ± 0.4 days (n = 33). The PrP13-SMN+/−, PrP90-SMN+/− and HSA63-SMN+/− SMA mice, have a minimal but significant increase in lifespan as compared with severe SMA mice (SMN2+/+; Smn−/−) (P < 0.003) whereas HSA69-SMN SMA mice had no increase in lifespan as compared with severe SMA mice. (B) Kaplan–Meier survival curves of HSA-SMN or PrP-SMN SMA mice showing a large increase in lifespan. Blue line: SMN2+/+; Smn−/−; HSA63-SMN+/+ mice show a mean survival of 160 ± 33.9 days [censored (surviving) animals are indicated by a red cross] (n = 20). Grey line: SMN2+/+; Smn−/−; PrP92-SMN+/− mice show a mean survival of 150 ± 100 days (n = 21) (censored animals, yellow cross). Red line: SMN2+/+; Smn−/−; PrP92-SMN+/+ mice show a mean survival of 210 ± 97 days (n = 46) (censored animals, blue cross). Purple line: SMA mice (SMN2+/+; Smn−/−) (n = 32) for comparison. Both PrP-SMN+/+ and HSA63-SMN+/+ SMA mice show a highly significant increase in lifespan at P < 0.000001. (C) Weight curves of SMA mice corrected with PrP92-SMN. SMN2+/+; Smn−/−; PrP92-SMN+/+ and SMN2+/+; Smn−/−; PrP92-SMN+/− are identical in weight to normal mice (Smn+/− or Smn+/+). All plots are shown as mean weight in grams at each day with error bars representing standard deviation. (D) A picture showing a carrier (SMN2+/+; Smn+/−), a PrP92-SMN SMA (SMN2+/+; Smn−/−; PrP92-SMN+/+) and a HSA63-SMN SMA (SMN2+/+; Smn−/−; HSA63-SMN+/+) mouse. Notice that the tail of the PrP92-SMN SMA mouse is one-third shorter than the normal tail and that the HSA63-SMN SMA mouse lacks a tail. The loss or reduction of tail size is noticed just prior to weaning (21 days). There were no alterations of the fore paws, hind paws or ears in these mice.
Figure 5
Figure 5
Immunohistochemical localization of SMN in the spinal cord of PrP92-SMN SMA mice. (A and B) SMN localization (red) in 8 μm spinal cord sections of PND04 control mice (SMN2+/+; Smn+/−) and (C and D) PrP92-SMN SMA mice (SMN2+/+; Smn−/−; PrP92-SMN+/+) without (A and C) and with (B and D) DAPI nuclear staining (blue). Diffuse cytoplasmic SMN staining is present in the control spinal cord sections while the PrP92-SMN SMA spinal cord sections reveal large cytoplasmic aggregates of SMN as well as an increased number of gems in the nucleus. Scalebar is 50 μm.
Figure 6
Figure 6
Muscle morphology of PrP92-SMN SMA mice. (A and B) Hematoxylin and eosin staining of gastrocnemius muscle of control (SMN2+/+; Smn+/−) (116 days old) and PrP92-SMN SMA mice (SMN2+/+; Smn−/−; PrP92-SMN+/+) (113 days old). (C and D) Distribution of muscle fiber size in control and PrP92-SMN SMA mice. The entire gastrocnemius was sectioned from each animal and the area of every muscle fiber in each cross-section determined. The mean fiber size area for the control was 2450 ± 34.4 μm2 (SE) and 2023.43 ± 24.3 μm2 for PrP92-SMN SMA mice with the mean difference of 427.2 μm2. The median fiber size area for the control was 2507 μm2 versus 1906 μm2 for the PrP92-SMN SMA mice. The means were not outside two standard deviations (control, 847.7 μm2 and PrP92-SMN, 649.7 μm2). However, it is clear that the distribution of fiber size is different between the two groups and this reflects in particular a greater number of smaller fibers in the PrP92-SMN SMA mice as demonstrated by the median fiber size values. The median fiber size is different between these two groups when tested by Wilcoxon–Mann-Whitney or two sample Kolmogorov–Simirnov test at P < 0.0001.
Figure 7
Figure 7
Number of axons in L4 ventral root of 1-year-old PrP-SMN and SMNA2G SMA mice. Individual roots are indicated by dots, the group mean by a horizontal line and the standard error by a vertical line. The SMNA2G, Smn−/−, SMN2+/+ group differs from all experimental groups with two-tailed P < 0.005 or less.

References

    1. Crawford TO, Pardo CA. The neurobiology of childhood spinal muscular atrophy. Neurobiol Dis. 1996;3:97–110. - PubMed
    1. Roberts DF, Chavez J, Court SD. The genetic component in child mortality. Arch Dis Child. 1970;45:33–38. - PMC - PubMed
    1. Lefebvre S, Burglen L, Reboullet S, Clermont O, Burlet P, Viollet L, Benichou B, Cruaud C, Millasseau P, Zeviani M, et al. Identification and characterization of a spinal muscular atrophy-determining gene. Cell. 1995;80:155–165. - PubMed
    1. Burghes AH. When is a deletion not a deletion? When it is converted. Am J Hum Genet. 1997;61:9–15. - PMC - PubMed
    1. Lorson CL, Hahnen E, Androphy EJ, Wirth B. A single nucleotide in the SMN gene regulates splicing and is responsible for spinal muscular atrophy. Proc Natl Acad Sci USA. 1999;96:6307–6311. - PMC - PubMed

Publication types

MeSH terms

Substances