Cell stiffening in response to external stress is correlated to actin recruitment
- PMID: 18178644
- PMCID: PMC2267136
- DOI: 10.1529/biophysj.107.118265
Cell stiffening in response to external stress is correlated to actin recruitment
Abstract
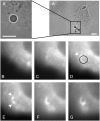
We designed a micromanipulation device that allows the local application of a constant force on living cells, and the measurement of their stiffness. The force is applied through an Arg-Gly-Asp-coated bead adhering on the cell and trapped in optical tweezers controlled by a feedback loop. Epifluorescence observations of green fluorescent protein-actin in the cells are made during force application. We observe a stiffening of cells submitted to a constant force within a few minutes, coupled to actin recruitment both at the bead-cell contact and up to several micrometers from the stress application zone. Moreover, kinetics of stiffening and actin recruitment exhibit a strong correlation. This work presents the first quantification of the dynamics of cell mechanical reinforcement under stress, which is a novel insight into the elucidation of the more general phenomenon of cell adaptation to stress.
Figures


Similar articles
-
Estimation of cell Young's modulus of adherent cells probed by optical and magnetic tweezers: influence of cell thickness and bead immersion.J Biomech Eng. 2007 Aug;129(4):523-30. doi: 10.1115/1.2746374. J Biomech Eng. 2007. PMID: 17655473
-
Airway smooth muscle tone modulates mechanically induced cytoskeletal stiffening and remodeling.J Appl Physiol (1985). 2005 Aug;99(2):634-41. doi: 10.1152/japplphysiol.00025.2005. Epub 2005 Apr 21. J Appl Physiol (1985). 2005. PMID: 15845778
-
A microfluidic system with optical laser tweezers to study mechanotransduction and focal adhesion recruitment.Lab Chip. 2011 Feb 21;11(4):684-94. doi: 10.1039/c0lc00487a. Epub 2010 Dec 8. Lab Chip. 2011. PMID: 21152510
-
Assembly and mechanosensory function of focal adhesions: experiments and models.Eur J Cell Biol. 2006 Apr;85(3-4):165-73. doi: 10.1016/j.ejcb.2005.11.001. Epub 2005 Dec 19. Eur J Cell Biol. 2006. PMID: 16360240 Review.
-
A Review on Quantitative Measurement of Cell Adhesion Strength.J Nanosci Nanotechnol. 2016 May;16(5):4256-73. doi: 10.1166/jnn.2016.10975. J Nanosci Nanotechnol. 2016. PMID: 27483746 Review.
Cited by
-
Physical biology in cancer. 5. The rocky road of metastasis: the role of cytoskeletal mechanics in cell migratory response to 3D matrix topography.Am J Physiol Cell Physiol. 2014 Jan 15;306(2):C110-20. doi: 10.1152/ajpcell.00283.2013. Epub 2013 Nov 6. Am J Physiol Cell Physiol. 2014. PMID: 24196535 Free PMC article. Review.
-
Cytoskeleton-mediated alterations of nuclear mechanics by extracellular mechanical signals.Biophys J. 2022 Jan 4;121(1):1-3. doi: 10.1016/j.bpj.2021.12.017. Epub 2021 Dec 22. Biophys J. 2022. PMID: 35000687 Free PMC article. No abstract available.
-
Prestress and adhesion site dynamics control cell sensitivity to extracellular stiffness.Biophys J. 2009 Mar 4;96(5):2009-22. doi: 10.1016/j.bpj.2008.10.072. Biophys J. 2009. PMID: 19254561 Free PMC article.
-
Extracellular matrix rigidity modulates physical properties of subcapsular sinus macrophage-B cell immune synapses.Biophys J. 2024 Aug 6;123(15):2282-2300. doi: 10.1016/j.bpj.2023.10.010. Epub 2023 Oct 14. Biophys J. 2024. PMID: 37840242 Free PMC article.
-
Rigidity sensing explained by active matter theory.Biophys J. 2011 Sep 21;101(6):L33-5. doi: 10.1016/j.bpj.2011.08.023. Epub 2011 Sep 20. Biophys J. 2011. PMID: 21943439 Free PMC article.
References
-
- Felsenfeld, D. P., D. Choquet, and M. P. Sheetz. 1996. Ligand binding regulates the directed movement of beta1 integrins on fibroblasts. Nature. 383:438–440. - PubMed
-
- Zamir, E., and B. Geiger. 2001. Molecular complexity and dynamics of cell-matrix adhesions. J. Cell Sci. 114:3583–3590. - PubMed
-
- Geiger, B., A. Bershadsky, R. Pankov, and K. M. Yamada. 2001. Transmembrane extracellular matrix-cytoskeleton crosstalk. Nat. Rev. Mol. Cell Biol. 2:793–805. - PubMed
Publication types
MeSH terms
Substances
LinkOut - more resources
Full Text Sources

