. 2008 Apr 1;94(7):2725-36.
doi: 10.1529/biophysj.107.122861. Epub 2008 Jan 4.

Evidence for intermediate S-states as initial phase in the process of oxygen-evolving complex oxidation

Affiliations

Evidence for intermediate S-states as initial phase in the process of oxygen-evolving complex oxidation

Jiri Jablonsky et al. Biophys J. .

Abstract

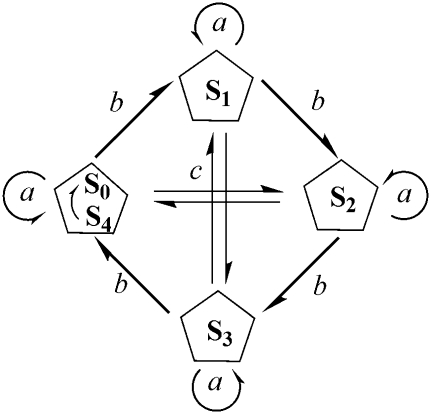
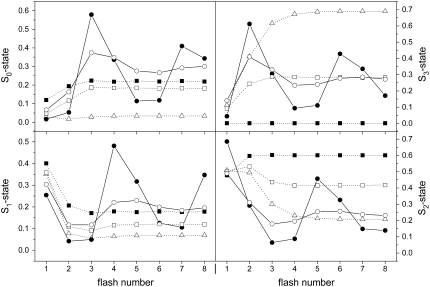
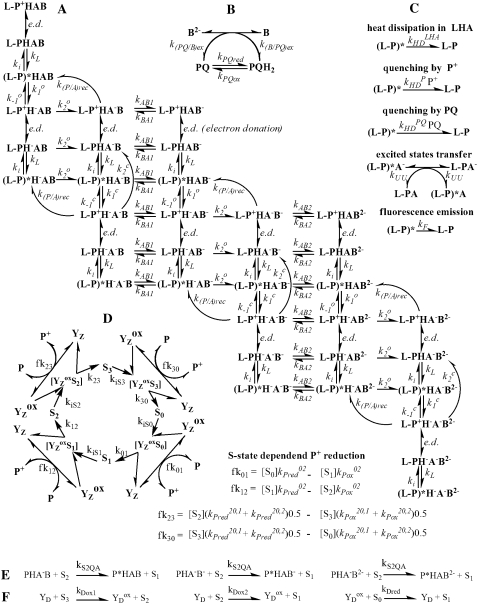
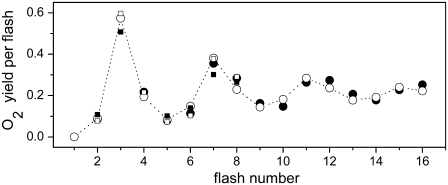
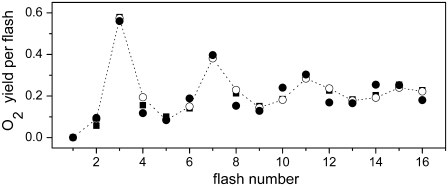
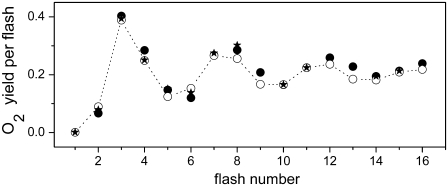
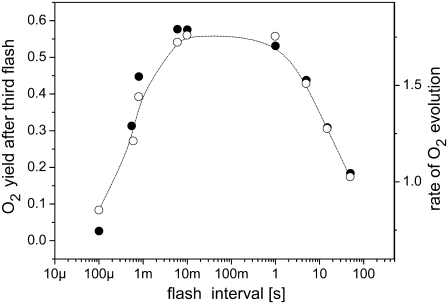
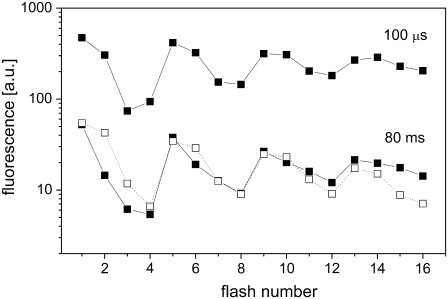
We have analyzed flash-induced period-four damped oscillation of oxygen evolution and chlorophyll fluorescence with the aid of a kinetic model of photosystem II. We have shown that, for simulation of the period-four oscillatory behavior of oxygen evolution, it is essential to consider the so-called intermediate S-state as an initial phase of each of the S(n)-S(n+1), (n = 0, 1, 2, 3) transitions. The intermediate S-states are defined as [S(n)Y(Z)(ox)]-states (n = 0, 1, 2, 3) and are formed with rate constant k(iSn) approximately 1.5 x 10(6) s(-1), which was determined from comparison of theoretical predictions with experimental data. The assumed intermediate S-states shift the equilibrium in reaction P680(+)Y(Z)<-->P680Y(Z)(ox) more to the right and we suggest that kinetics of the intermediate S-states reflects a relaxation process associated with changes of the redox equilibrium in the above reaction. The oxygen oscillation is simulated without the miss and double-hit parameters, if the intermediate S-states, which are not the source of the misses or the double-hits, are included in the simulation. Furthermore, we have shown that the intermediate S-states, together with S(2)Q(A)(-) charge recombination, are prerequisites for the simulation of the period-four oscillatory behavior of the chlorophyll fluorescence.


Figures

SCHEME 1
SCHEME 1
Kok model for oxygen evolution which, for the purpose of successful description of damped period-four oscillation of oxygen evolution induced by flash-train, introduces two parameters: misses (a) that characterize a failure to advance from Sn-state to Sn+1-state and double-hits (c) which characterize transition from Sn-state to Sn+2-state. Parameter b characterizes the most likely transition from Sn-state to Sn+1-state.
FIGURE 1
FIGURE 1
Simulations of the flash-induced changes of the S-state distribution. Initial conditions of simulations: 75% of OEC in the S1-state, 25% of OEC in the S0-state. Open triangles show simulations based on the earlier (16) kinetic model of PSII. Open and solid squares show simulations based on modified earlier model tested with two suggested kinetics (kiS3) of the incorporated S4-state, 5000 s−1 (as S3 → S4 → S0) or 1.5 × 10⁶ s−1 (as S3 + formula image), respectively (in text). Open and solid circles show simulations based on modified model with incorporated intermediate S-states (i.e., formation of [formula image] (n = 0, 1, 2, 3) during each Sn-Sn+1 transition) with rates of their formations kiS0 = kiS1 = kiS2 = kiS3 = kiSn = 3 × 10⁴ s−1 or 1.5 × 10⁶ s−1, respectively.
SCHEME 2
SCHEME 2
The introduced kinetic model of PSII used for simulations of flash-induced period-four oxygen and chlorophyll fluorescence oscillations (see Table 1 for definitions).
FIGURE 2
FIGURE 2
Comparison of theoretical and experimental data of the period-four oxygen oscillation induced by eight (for unsatisfactory simulations) or 16 flashes. Initial conditions for simulations are the same as for measured data (24): 3-μs flash and 500-ms dark interval between the flashes, initially 89% of oxidized YD, 100% of OEC in the S1-state. Open circles show experimental data redrawn from Isgandarova et al. (24). Solid circles (kiSn = 1.5 × 10⁶ s−1), solid (kiSn = 5 × 10⁵ s−1) and open (kiSn = 2.5 × 10⁶ s−1) squares, show simulations based on our introduced kinetic model of PSII which, in addition to the intermediate S-states (Scheme 2 D), includes the formula image recombination, YD reduction/oxidation (Scheme 2, E and F, respectively), and assumes 25% of QB to be initially in the formula image state. Values of rate constants are listed in Tables 2 and 3. Note that solid circles describing simulated oxygen yield after the second, third, and fifth flashes are hidden behind the open circles.
FIGURE 3
FIGURE 3
Comparison of theoretical and experimental data of the period-four oxygen oscillation induced by 16 flashes. Initial conditions for simulations are the same as for measured data (24) (Fig. 2). Open circles show experimental data redrawn from Isgandarova et al. (24). Solid squares (different kinetics of the intermediate S-states in the lower and higher S-states) and solid circles (high misses during the S2-S3 transition) show theoretical simulations for S-state dependent kinetics of the intermediate S-states. Model used for simulations is the same as used for simulations of the oscillations presented by solid circles in Fig. 2.
FIGURE 4
FIGURE 4
Comparison of theoretical and experimental data of the period-four oxygen oscillation induced by 16 flashes. Initial conditions for simulations are the same as for measured data (24): 3-μs flash and 500-ms dark interval between the flashes, initially 55% of reduced YD, 100% of OEC in the S1-state. Open circles show experimental data redrawn from Isgandarova et al. (24). Model used for simulations presented by solid circles (kiSn = 1.5 × 10⁶ s−1) is the same as used for simulations of the oscillations presented by solid circles in Fig. 2. Solid stars show theoretical simulations based on fivefold slowdown of the intermediate S-states (kiSn = 3 × 10⁵ s−1) in the presence of reduced YD.
FIGURE 5
FIGURE 5
Comparison of simulated (solid circles) oxygen yield after the third flash (Y3) and experimentally measured rate of O2 evolution (open circles; data redrawn from (5)) as a function of flash frequency. Model, used here, is the same as that for simulations of the oscillations presented by solid circles in Fig. 2. The experimental rate of oxygen evolution was measured in continuous illumination which started 1 s after the second flash was fired at variable time intervals after the first flash.
FIGURE 6
FIGURE 6
Comparison of theoretical and experimental data of oscillation of delayed chlorophyll fluorescence emission induced by 16 flashes. Initial conditions for simulations are the same as for measured data (53): assumption of 5-min dark adaptation (25% of OEC in the S0-state and 75% of OEC in the S1-state), 3-μs flash and 630-ms dark interval between the flashes. Open squares show experimental data redrawn from Delrieu and Rosengard (53). Solid squares show theoretical simulations based on our model (Scheme 2).

Comment in

References

    1. Wydrzynski, T., and K. Satoh. 2005. Photosystem II: The Water/Plastoquinone Oxido-Reductase in Photosynthesis. Kluwer Academic Publishers, Dordrecht, The Netherlands.
    1. Joliot, P., G. Barbieri, and R. Chabaud. 1969. A new model of photochemical centers in system 2. Photochem. Photobiol. 10:309–329.
    1. Joliot, P. 2003. Period-four oscillations of the flash-induced oxygen formation in photosynthesis. Photosynth. Res. 76:65–72. - PubMed
    1. Shinkarev, V. P. 2005. Flash-induced oxygen evolution and other oscillation processes in photosystem II. In Photosystem II: The Water/Plastoquinone Oxido-Reductase in Photosynthesis. T. Wydrzynski and K. Satoh, editors. Kluwer Academic Publishers, Dordrecht, The Netherlands.
    1. Kok, B., B. Forbush, and M. McGloin. 1970. Cooperation of charges in photosynthetic O2 evolution. I. A linear four-step mechanism. Photochem. Photobiol. 11:457–475. - PubMed

Publication types

LinkOut - more resources