. 2008 Apr 15;94(8):3035-46.
doi: 10.1529/biophysj.107.114843. Epub 2008 Jan 4.

Characterization of the interactions between fluoroquinolone antibiotics and lipids: a multitechnique approach

Affiliations

Characterization of the interactions between fluoroquinolone antibiotics and lipids: a multitechnique approach

Hayet Bensikaddour et al. Biophys J. .

Abstract

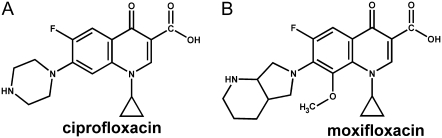
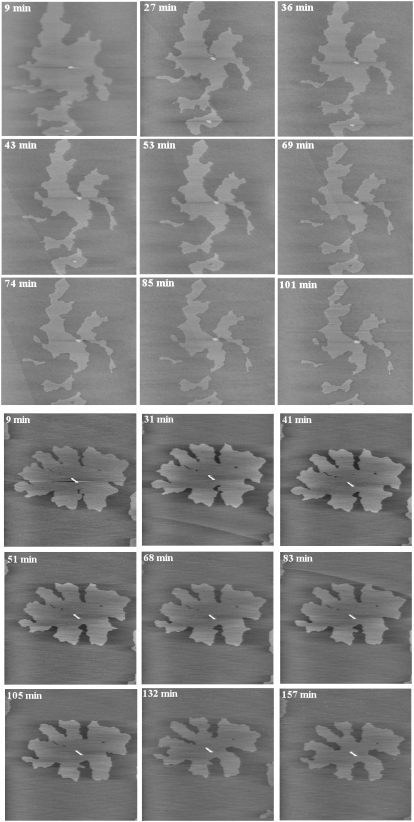
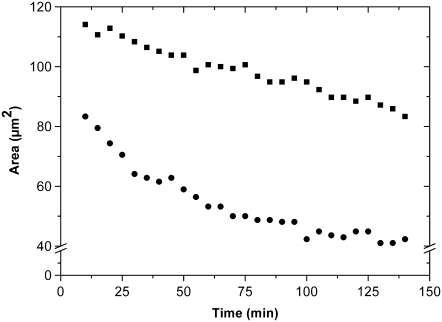
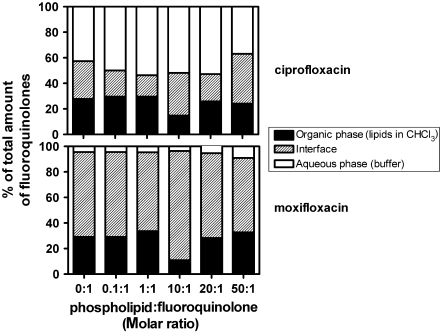
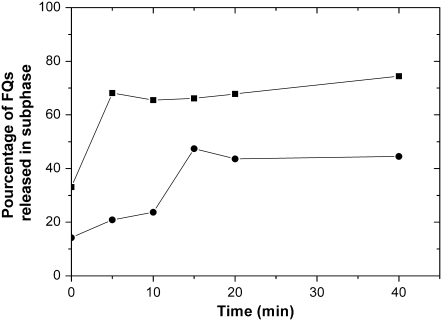
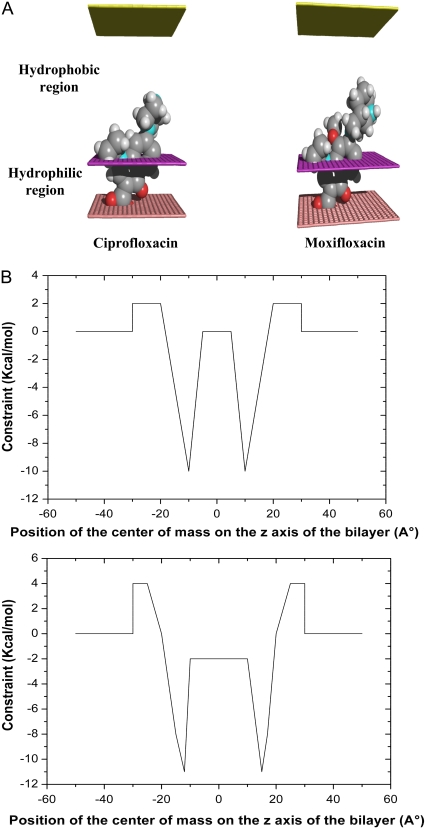
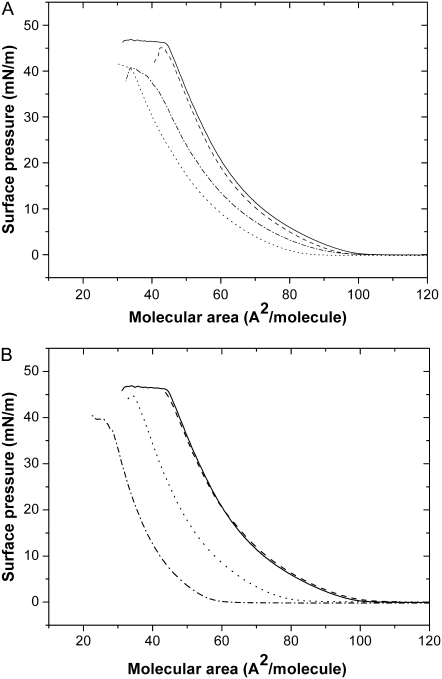
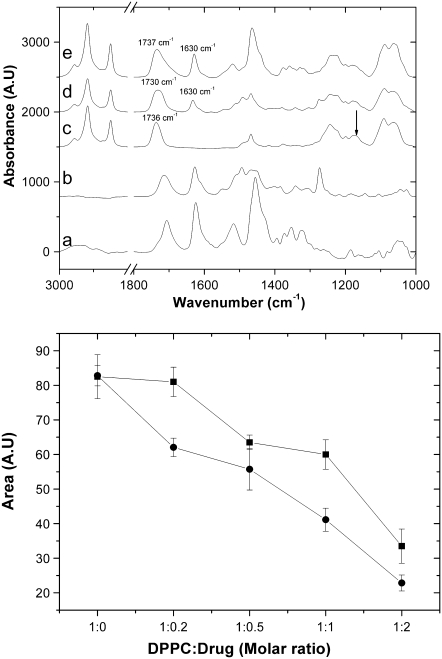
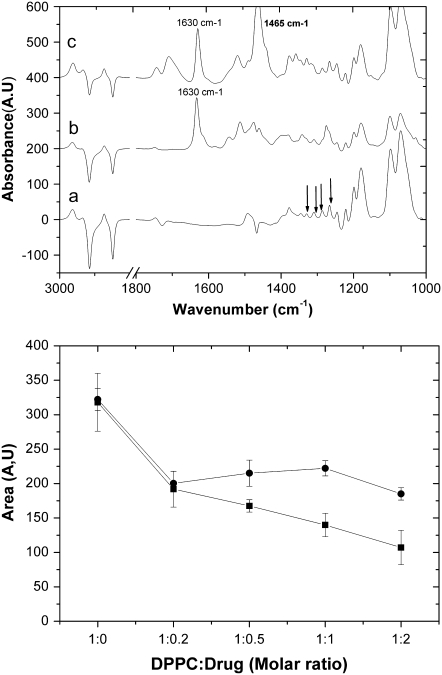
Probing drug/lipid interactions at the molecular level represents an important challenge in pharmaceutical research and membrane biophysics. Previous studies showed differences in accumulation and intracellular activity between two fluoroquinolones, ciprofloxacin and moxifloxacin, that may actually result from their differential susceptibility to efflux by the ciprofloxacin transporter. In view of the critical role of lipids for the drug cellular uptake and differences observed for the two closely related fluoroquinolones, we investigated the interactions of these two antibiotics with lipids, using an array of complementary techniques. Moxifloxacin induced, to a greater extent than ciprofloxacin, an erosion of the DPPC domains in the DOPC fluid phase (atomic force microscopy) and a shift of the surface pressure-area isotherms of DOPC/DPPC/fluoroquinolone monolayer toward lower area per molecule (Langmuir studies). These effects are related to a lower propensity of moxifloxacin to be released from lipid to aqueous phase (determined by phase transfer studies and conformational analysis) and a marked decrease of all-trans conformation of acyl-lipid chains of DPPC (determined by ATR-FTIR) without increase of lipid disorder and change in the tilt between the normal and the germanium surface (also determined by ATR-FTIR). All together, differences of ciprofloxacin as compared to moxifloxacin in their interactions with lipids could explain differences in their cellular accumulation and susceptibility to efflux transporters.


Figures

FIGURE 1
FIGURE 1
(A) Structural formula of ciprofloxacin (3-quinolinecarboxylic acid, 1-cyclopropyl-6-fluoro-1,4-dihydro-4-oxo-7-(1-piperazinyl)-(9CI)) and (B) moxifloxacin (3-quinolinecarboxylic acid, 1-cyclopropyl-6-fluoro-1,4-dihydro-8-methoxy-7-((4aS,7aS)-octahydro-6H-pyrrolo(3,4-b)pyridin-6-yl)-4-oxo-(9CI)).
FIGURE 2
FIGURE 2
AFM height images (20 μm × 20 μm (top panels) or 15 μm × 15 μm (bottom panels), z-scale: 5 nm) of a mixed DOPC/DOPC (1:1, mol/mol) bilayer recorded in Tris 10 mM, NaCl 100 mM buffer, pH 7.4 containing 1 mM of ciprofloxacin (top panels) or moxifloxacin (bottom panels) at increasing incubation time.
FIGURE 3
FIGURE 3
Evolution of the area of the DPPC domain (Fig. 2) with time for DOPC/DPPC bilayers incubated in Tris 10 mM, NaCl 100 mM buffer, pH 7.4, containing 1 mM of ciprofloxacin (solid squares) or moxifloxacin (solid circles).
FIGURE 4
FIGURE 4
Phase transfer of ciprofloxacin (1 μM, top panel) and moxifloxacin (1 μM, bottom panel) in Tris buffer pH 7.4 against increasing amounts of PC (from 0.1:1 up to a lipid/drug ratio of 50:1) in chloroform. (Open bars) Drug in aqueous phase. (Hatched bars) Drug at interface (calculated from the difference between initial drug concentration and measured drug in aqueous and organic phase). (Solid bars) Drug in organic phase. Experiments were reproduced at least three times with similar results.
FIGURE 5
FIGURE 5
Kinetics of the release of fluoroquinolones from the mixed lipids/fluoroquinolones monolayer to the subphase (10 mM Tris pH 7.4, 25°C). Results are expressed as the percentage of fluoroquinolones initially present in the monolayer. Ciprofloxacin, ▪; and moxifloxacin, •. Molar proportion of DPPC/DOPC/fluoroquinolones (1:1:2).
FIGURE 6
FIGURE 6
Molecular modeling of the interactions between ciprofloxacine and moxifloxacine with an implicit membrane. (A) Most favorable position of the ciprofloxacin (left) and moxifloxacin (right) in a lipid bilayer. (B) Restraints versus the position of the ciprofloxacin (up) and moxifloxacin (down) in the bilayer. Constraints are expressed in kcal/mol and the positions are expressed in Ångstroms.
FIGURE 7
FIGURE 7
Surface pressure-molecular area isotherms of DOPC/DPPC in the presence of ciprofloxacin (A) and moxifloxacin (B), on a subphase of 10 mM Tris at pH 7.4 and 25°C. Mean molecular area were corrected to take into account the percentage of fluoroquinolone remaining at the interface. DOPC/DPPC/drug molar ratio were 1:1:0 (continuous line), 1:1:0.4 (discontinuous line), 1:1:1 (dotted line), and 1:1:2 (dash-dotted line).
FIGURE 8
FIGURE 8
Fluoroquinolones effect on the conformation of DPPC monolayer as revealed by the infrared absorbance spectra. (Top panel) ATR-FTIR spectra of moxifloxacin (a), ciprofloxacin (b), DPPC (c), DPPC/ciprofloxacin (d), and DPPC/moxifloxacin (e). DPPC was used at 50 mg/ml and the molar ratio of lipid/drug was 1:1. (Bottom panel) Evolution of the peak area at 1200 cm−1 (wagging γw(CH2) band; integrated between 1206 and 1193 cm−1) as a function of increasing lipid/drug ratio: 1:0, 1:0,2, 1:0,5, 1:1, and 1:2. Ciprofloxacin, ▪; and moxifloxacin, •.
FIGURE 9
FIGURE 9
Fluoroquinolones effect on the orientation of DPPC monolayer as revealed by ATR-FTIR dichroic spectra. (Top panel) Polarized ATR-FTIR spectra of DPPC (a), DPPC/ciprofloxacin (b), and DPPC/moxifloxacin (c). DPPC was used at 50 mg/ml and the molar ratio of lipid/drug was 1:1. Wagging γw(CH2) bands are indicated by arrows. (Bottom panel) Area evolution of dichroic peak of 1200 cm−1 of DPPC in the presence of fluoroquinolones. Integration area of dichroic γw(CH2) band (integrated between 1206 and 1193 cm−1) was plotted versus DPPC/drug molar ratio as indicated, in the presence of ciprofloxacin, ▪; and moxifloxacin, •.

Similar articles

Cited by

References

    1. Michot, J. M., C. Seral, F. Van Bambeke, M. P. Mingeot-Leclercq, and P. Tulkens. 2005. Influence of efflux transporters on the accumulation and efflux of four quinolones (ciprofloxacin, levofloxacin, garenoxacin, and moxifloxacin) in J774 macrophages. Antimicrob. Agents Chemother. 49:2429–2437. - PMC - PubMed
    1. Bakker-Woudenberg, I. A., M. T. ten Kate, L. Guo, P. Working, and J. W. Mouton. 2001. Improved efficacy of ciprofloxacin administered in polyethylene glycol-coated liposomes for treatment of Klebsiella pneumoniae pneumonia in rats. Antimicrob. Agents Chemother. 45:1487–1492. - PMC - PubMed
    1. Bakker-Woudenberg, I. A., M. T. ten Kate, L. Guo, P. Working, and J. W. Mouton. 2002. Ciprofloxacin in polyethylene glycol-coated liposomes: efficacy in rat models of acute or chronic Pseudomonas aeruginosa infection. Antimicrob. Agents Chemother. 46:2575–2581. - PMC - PubMed
    1. Wong, J. P., H. Yang, K. L. Blasetti, G. Schnell, J. Conley, and L. N. Schofield. 2003. Liposome delivery of ciprofloxacin against intracellular Francisella tularensis infection. J. Control. Release. 92:265–273. - PubMed
    1. Rolston, K. V., D. Yadegarynia, D. P. Kontoyiannis, I. I. Raad, and D. H. Ho. 2006. The spectrum of Gram-positive bloodstream infections in patients with hematologic malignancies, and the in vitro activity of various quinolones against Gram-positive bacteria isolated from cancer patients. Int. J. Infect. Dis. 10:223–230. - PubMed

Publication types

MeSH terms