. 2008 Jan;20(1):11-24.
doi: 10.1105/tpc.107.056309. Epub 2008 Jan 4.

Identification and characterization of shared duplications between rice and wheat provide new insight into grass genome evolution

Affiliations

Identification and characterization of shared duplications between rice and wheat provide new insight into grass genome evolution

Jérôme Salse et al. Plant Cell. 2008 Jan.

Abstract

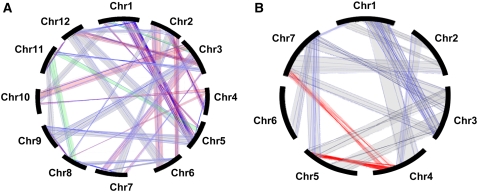
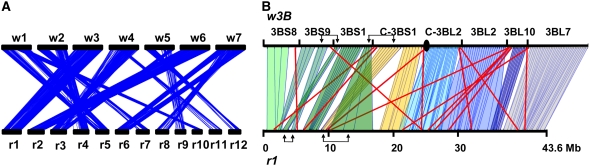
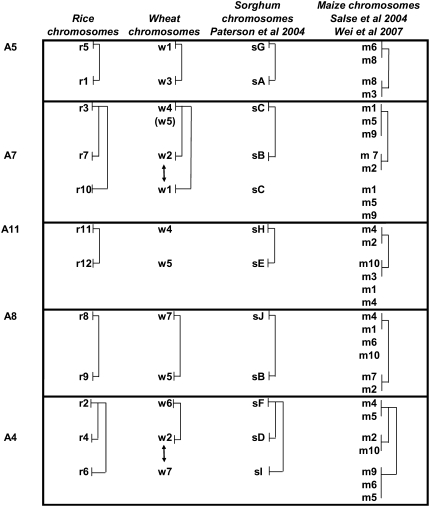
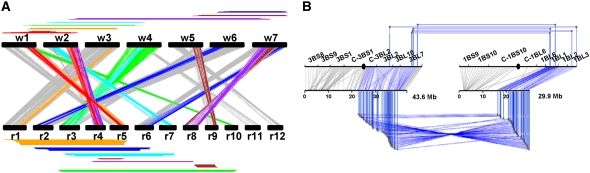
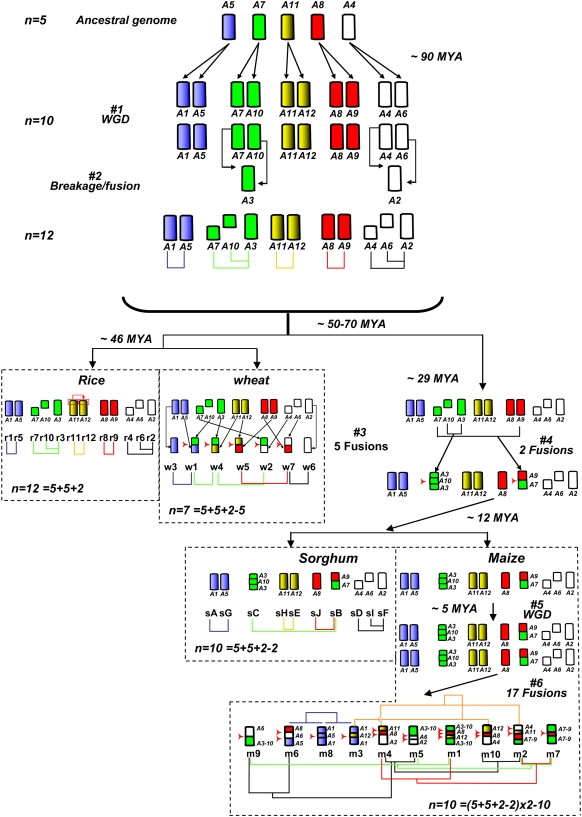
The grass family comprises the most important cereal crops and is a good system for studying, with comparative genomics, mechanisms of evolution, speciation, and domestication. Here, we identified and characterized the evolution of shared duplications in the rice (Oryza sativa) and wheat (Triticum aestivum) genomes by comparing 42,654 rice gene sequences with 6426 mapped wheat ESTs using improved sequence alignment criteria and statistical analysis. Intraspecific comparisons identified 29 interchromosomal duplications covering 72% of the rice genome and 10 duplication blocks covering 67.5% of the wheat genome. Using the same methodology, we assessed orthologous relationships between the two genomes and detected 13 blocks of colinearity that represent 83.1 and 90.4% of the rice and wheat genomes, respectively. Integration of the intraspecific duplications data with colinearity relationships revealed seven duplicated segments conserved at orthologous positions. A detailed analysis of the length, composition, and divergence time of these duplications and comparisons with sorghum (Sorghum bicolor) and maize (Zea mays) indicated common and lineage-specific patterns of conservation between the different genomes. This allowed us to propose a model in which the grass genomes have evolved from a common ancestor with a basic number of five chromosomes through a series of whole genome and segmental duplications, chromosome fusions, and translocations.


Figures

Figure 1.
Figure 1.
Intraspecific Duplications of the Rice and Wheat Genomes. (A) Schematic representation of the 539 pairs of paralogous genes (linked by thin blue lines) defining 29 duplication blocks on the 12 rice chromosomes. The 10 duplicated regions identified previously (Yu et al., 2005) are highlighted in red, the 3 newly detected duplications are indicated in green, and the 16 duplicated regions found within the 13 segments previously identified are in gray. (B) Schematic representation of the 10 duplicated regions and 2 translocations identified on the seven wheat chromosome groups. Duplicated segments are shown in gray, with thin blue lines representing the duplicated genes within each segment. The translocations between w4-w5 and w4-w7 are highlighted in red.
Figure 2.
Figure 2.
Identification of 13 Orthologous Regions between Rice and Wheat. (A) Schematic representation of the 13 orthologous regions identified between rice (r1 to r12) and wheat (w1 to w7) chromosomes. The 1108 pairs of orthologous genes are depicted as thin blue lines. (B) Schematic representation of the 149 orthologs (vertical lines) identified between wheat chromosome 3B (w3B) and rice chromosome 1 (r1). Different colored blocks represent the colinear regions identified between r1 and w3B. Rearrangements between orthologous genes are highlighted with red lines. Two large inversions of colinear regions are indicated with arrows above and below the wheat and rice chromosomes, respectively. Wheat deletion bins are indicated above the 3B chromosome, whereas rice chromosome 1 is divided into 10-Mb segments.
Figure 3.
Figure 3.
Orthologous Relationships and Shared Duplications between the Rice, Maize, Wheat, and Sorghum Genomes. Colinear wheat, rice, sorghum, and maize chromosomes are displayed on the same line in the figure. Duplications are indicated with solid lines. The five blocks of shared duplications identified in the four genomes are displayed on the right side of the ancestral chromosomes (A5, A7, A11, A8, and A4) that they define. The artefactual syntenic relationship identified between w5 and r3 that reflects the wheat w4-w5 translocation is indicated in parentheses. The two duplications shared between wheat and rice chromosomes that do not share a common ancestry (w1-r10/w2-r7 and w7-r6/w2-r4) but are found on orthologous chromosomes in both species are indicated with double arrows.
Figure 4.
Figure 4.
Seven Duplications Are Shared between Rice and Wheat. (A) Schematic representation of the seven duplicated regions shared between wheat and rice. The paralogous regions are represented with the same colors in wheat (top) and rice (bottom) as well as the corresponding orthologous regions identified between the two sets of chromosomes (center). The color code is as follows: w1-w2/r5-r4 (red), w1-w3/r5-r1 (orange), w1-w4/r10-r3 (green), w2-w4/r7-r3 (light blue), w2-w7/r4-r8 (purple), w5-w7/r9-r8 (brown), and w6-w7/r2-r6 (dark blue). Rice–wheat orthologs not involved in shared duplications are indicated in gray. (B) Schematic representation of the duplications shared between rice chromosomes 5 to 1 (42 paralogs linked by horizontal lines at bottom) and wheat chromosomes 1B to 3B (five paralogs linked by horizontal lines at top). The rice and wheat colinear regions r1-w3B and r5-w1B are linked by 149 and 66 orthologs (vertical lines), respectively.
Figure 5.
Figure 5.
Model for the Structural Evolution of the Rice, Wheat, Sorghum, and Maize Genomes from a Common Ancestor with n = 5 Chromosomes. Chromosomes are represented with color codes to illuminate the evolution of segments from a common ancestor with five chromosomes. The five chromosomes are named according to the rice nomenclature. Different events that have shaped the structure of the different grass genomes during their evolution from the common ancestor are indicated with #. For each species, chromosome numbers are followed by a formula indicating the evolutionary origin of this number (e.g., in wheat, n = 7 = 5 [ancestor] + 5 [WGD] + 2 [aneuploid segmental duplication] – 5 [chromosome fusion]). Where possible, divergence times are indicated based on previous estimates by Gaut (2002), Swigonova et al. (2004), and Paterson et al. (2004).

Similar articles

Cited by

References

    1. Ahn, S., and Tanksley, S.D. (1993). Comparative linkage maps of the rice and maize genomes. Proc. Natl. Acad. Sci. USA 90 7980–7984. - PMC - PubMed
    1. Altschul, S.F., Gish, W., Miller, W., Myers, E.W., and Lipman, D.J. (1990). Basic local alignment search tool. J. Mol. Biol. 215 403–410. - PubMed
    1. Altschul, S.F., Madden, T.L., Schaffer, A.A., Zhang, J., Zhang, Z., Miller, W., and Lipman, D.J. (1997). Gapped BLAST and PSI-BLAST: A new generation of protein database search programs. Nucleic Acids Res. 25 3389–3402. - PMC - PubMed
    1. Bennetzen, J.L. (2005). Transposable elements, gene creation and genome rearrangement in flowering plants. Curr. Opin. Genet. Dev. 15 621–627. - PubMed
    1. Blake, N.K., Lehfeldt, B.R., Lavin, M., and Talbert, L.E. (1999). Phylogenetic reconstruction based on low copy DNA sequence data in an allopolyploid: The B genome of wheat. Genome 42 351–360. - PubMed

Publication types

LinkOut - more resources