. 2008 Apr;325(1):276-83.
doi: 10.1124/jpet.107.131987. Epub 2008 Jan 4.

Haloperidol and clozapine differentially affect the expression of arrestins, receptor kinases, and extracellular signal-regulated kinase activation

Affiliations

Haloperidol and clozapine differentially affect the expression of arrestins, receptor kinases, and extracellular signal-regulated kinase activation

Mohamed Rafiuddin Ahmed et al. J Pharmacol Exp Ther. 2008 Apr.

Abstract

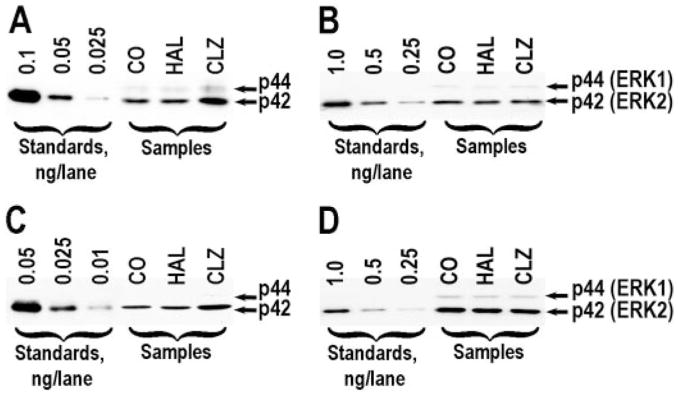
Dopamine and other G protein-coupled receptors (GPCRs) represent the major target of antipsychotic drugs. GPCRs undergo desensitization via activation-dependent phosphorylation by G protein-coupled receptor kinases (GRKs) followed by arrestin binding. Arrestins and GRKs are major regulators of GPCR signaling. We elucidated changes in expression of two arrestins and four GRKs following chronic (21 days) treatment with haloperidol (1 mg/kg i.p.) or clozapine (20 mg/kg i.p.) 2 or 24 h after the last injection in 11 brain regions. Haloperidol decreased GRK3 in ventrolateral caudate-putamen and transiently down-regulated GRK5 in globus pallidus and caudal caudate-putamen. Clozapine also caused a short-term suppression of the GRK5 expression in the caudal caudate-putamen and globus pallidus, but, unlike haloperidol, elevated GRK5 in the caudal caudate-putamen after 24 h. Unlike haloperidol, clozapine decreased arrestin2 and GRK3 in hippocampus and GRK3 in globus pallidus but increased arrestin2 in the core of nucleus accumbens and ventrolateral caudate-putamen and GRK2 in prefrontal cortex. Clozapine, but not haloperidol, induced long-term activation of extracellular signal-regulated kinase (ERK) 2 in ventrolateral caudate-putamen and transient in prefrontal cortex. The data demonstrate that haloperidol and clozapine differentially affect the expression of arrestins and GRKs and ERK activity, which may play a role in determining their clinical profile.


Figures

Fig. 1
Fig. 1
Comparative expression levels of arrestin and GRK subtypes in the control rat brains. Bar graph, means ± S.E.M. Conditions for Western blotting and antibody labeling were as described under Materials and Methods. ACsh, shell subdivision of the nucleus accumbens; Cg, cingulate cortex; DL, dorsolateral subdivision of the striatum; DM, dorsomedial subdivision of the striatum; VM, ventromedial subdivision of the striatum.
Fig. 2
Fig. 2
Representative Western blot demonstrating antibody specificity and the expression of GRKs in the rat brain. A, expression of GRK2; B, labeling of GRK3 compared with GRK2 by the antibody directed against GRK3. Right lanes show the indicated amount of purified GRK2 and GRK3 run on the same gel; C, expression of GRK5; D, antibody specificity and expression of GRK6. Left lanes show standards containing the indicated amounts of purified GRKs. The following lanes show bands of GRK subtypes detected in the rat brain. To detect GRK2 and GRK5, 0.625 μg of total protein was loaded per lane; to detect GRK3, 1.25 μg protein/lane; and to detect GRK6, 5 μg protein/lane. Antibodies to GRK2 and GRK5 (in most regions) selectively label one band corresponding to the appropriate kinase. The antibody against GRK3 also labels GRK2, but the two kinases are clearly separated on 8% polyacrylamide gel electrophoresis. The antibody directed against GRK6 labels extraneous bands, but the band corresponding to GRK6 is clearly separated from others on 8% polyacrylamide gel electrophoresis. Abbreviations are the same as in Fig. 1.
Fig. 3
Fig. 3
Expression of arrestin2 (A) and GRK2 (B) in the rat brain after chronic treatment with haloperidol or clozapine. Drug treatment was as described under Materials and Methods. Bar graphs show the results of quantitative analysis of Western blots as percentages (mean ± S.E.M.) from corresponding (2 or 24 h) control values. Note that for statistical analysis, absolute values were used. Also note that S.E.s for ratios are more than 2-fold larger that S.E.s of absolute values. Between 0.45 and 1.25 μg protein/lane (less for cortical regions) were used. The data were statistically analyzed separately for individual brain regions by two-way analysis of variance with group (control, haloperidol, clozapine) and time (2 and 24 h) as main factors followed by Student-Newman-Keuls post hoc test. *, p < 0.05; **, p < 0.01 to control; #, p < 0.05 to the haloperidol (both clozapine groups are different from both haloperidol groups). Co2h and Co24h, control groups treated with saline and sacrificed 2 or 24 h after the last injections; HAL-2h and HAL-24h, groups treated with haloperidol; CLZ-2h and CLZ-24h, groups treated with clozapine. Abbreviations for the brain regions are the same as in Fig. 1.
Fig. 4
Fig. 4
Expression of GRK3 (A) and GRK5 (B) in the rat experimental groups presented as percentages from corresponding (2 or 24 h) control values. GRK3 was measured using 2.5 μg protein/lane, and GRK5 was measured using 1.25 μg protein/lane. The data were statistically analyzed and are presented as described in the legend to Fig. 3 and Materials and Methods. *, p < 0.05 to control; #, both clozapine groups are different from both haloperidol groups with p < 0.05; $, p < 0.05 to the corresponding haloperidol group. Abbreviations are as listed in legends to Figs. 1 and 3.
Fig. 5
Fig. 5
Representative Western blots illustrating the levels of ERK phosphorylation and expression in the PFC and dorsolateral striatum (DL) of rats treated with haloperidol (HAL) and clozapine (CLZ). A and C, phospho-ERK in PFC (A) and VL (C); B and D, total ERK in PFC (B) and VL (D). Abbreviations are as listed in legends to Figs. 1 and 3.
Fig. 6
Fig. 6
The concentration of phosphorylated ERK2 (p42 MAPK) in the rat brain after chronic treatment with haloperidol or clozapine shown as percentages from corresponding (2 or 24 h) control values. The data were statistically analyzed as described in the legend to Fig. 3 and Materials and Methods. *, p < 0.05 to control; #, p < 0.05 to haloperidol (both clozapine groups are different from both haloperidol groups). Abbreviations are as listed in legends to Figs. 1 and 3.

References

    1. Abi-Dargham A, Laruelle M. Mechanisms of action of second generation antipsychotic drugs in schizophrenia: insights from brain imaging studies. Eur Psychiatry. 2005;20:15–27. - PubMed
    1. Ahmed MR, Bychkov ER, Gurevich VV, Benovic JL, Gurevich EV. Altered expression and subcellular distribution of GRK subtypes in the dopamine-depleted rat basal ganglia is not normalized by L-DOPA treatment. J Neurochem. 2007 in press. - PMC - PubMed
    1. Ahn S, Nelson CD, Garrison TR, Miller WE, Lefkowitz RJ. Desensitization, internalization, and signaling functions of beta-arrestins demonstrated by RNA interference. Proc Natl Acad Sci U S A. 2003;100:1740–1744. - PMC - PubMed
    1. Alimohamad H, Rajakumar N, Seah YH, Rushlow W. Antipsychotics alter the protein expression levels of beta-catenin and GSK-3 in the rat medial prefrontal cortex and striatum. Biol Psychiatry. 2005;57:533–542. - PubMed
    1. Baldessarini RJ, Centorrino F, Flood JG, Volpicelli SA, Huston-Lyons D, Cohen BM. Tissue concentrations of clozapine and its metabolites in the rat. Neuropsychopharmacology. 1993;9:117–124. - PubMed

Publication types

MeSH terms

LinkOut - more resources