

EST2uni: an open, parallel tool for automated EST analysis and database creation, with a data mining web interface and microarray expression data integration
- PMID: 18179701
- PMCID: PMC2258287
- DOI: 10.1186/1471-2105-9-5
EST2uni: an open, parallel tool for automated EST analysis and database creation, with a data mining web interface and microarray expression data integration
Abstract
Background: Expressed sequence tag (EST) collections are composed of a high number of single-pass, redundant, partial sequences, which need to be processed, clustered, and annotated to remove low-quality and vector regions, eliminate redundancy and sequencing errors, and provide biologically relevant information. In order to provide a suitable way of performing the different steps in the analysis of the ESTs, flexible computation pipelines adapted to the local needs of specific EST projects have to be developed. Furthermore, EST collections must be stored in highly structured relational databases available to researchers through user-friendly interfaces which allow efficient and complex data mining, thus offering maximum capabilities for their full exploitation.
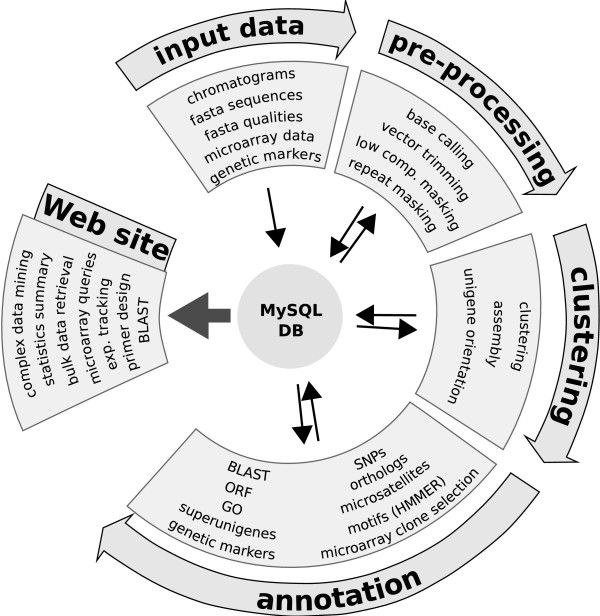
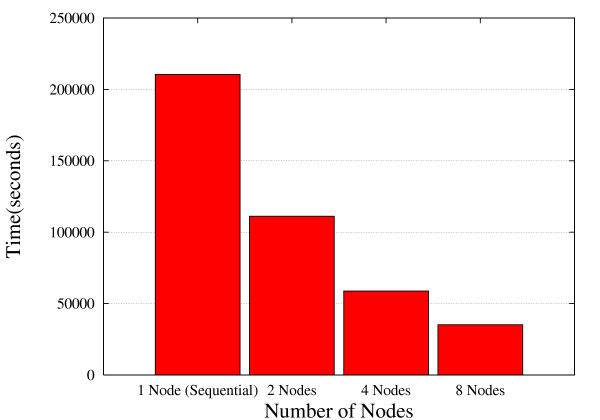
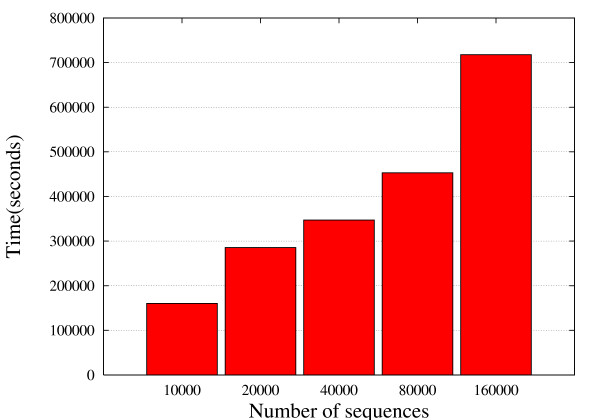
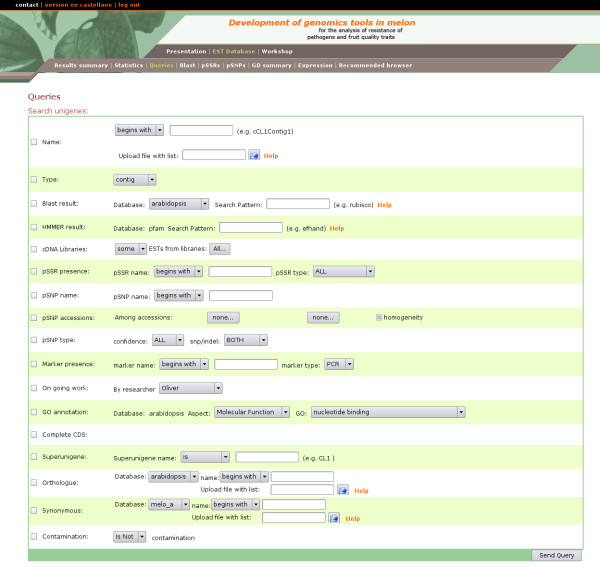
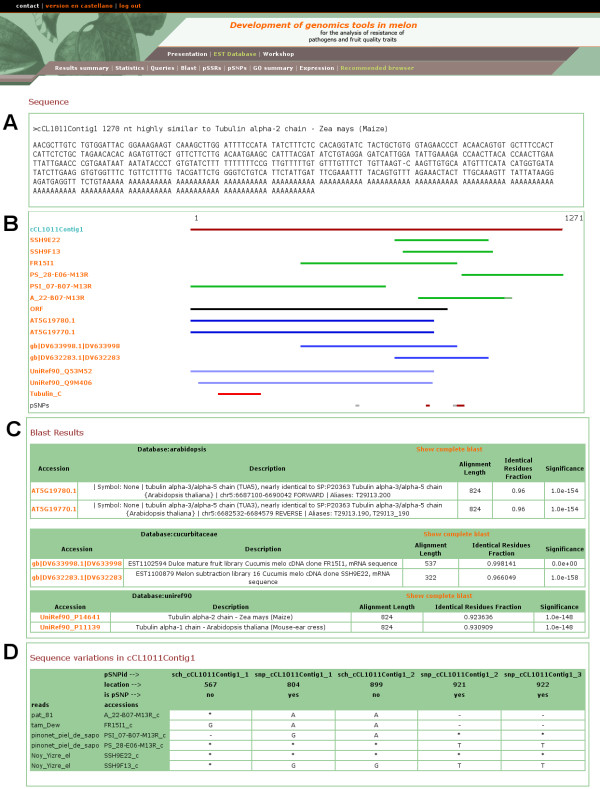
Results: We have created EST2uni, an integrated, highly-configurable EST analysis pipeline and data mining software package that automates the pre-processing, clustering, annotation, database creation, and data mining of EST collections. The pipeline uses standard EST analysis tools and the software has a modular design to facilitate the addition of new analytical methods and their configuration. Currently implemented analyses include functional and structural annotation, SNP and microsatellite discovery, integration of previously known genetic marker data and gene expression results, and assistance in cDNA microarray design. It can be run in parallel in a PC cluster in order to reduce the time necessary for the analysis. It also creates a web site linked to the database, showing collection statistics, with complex query capabilities and tools for data mining and retrieval.
Conclusion: The software package presented here provides an efficient and complete bioinformatics tool for the management of EST collections which is very easy to adapt to the local needs of different EST projects. The code is freely available under the GPL license and can be obtained at http://bioinf.comav.upv.es/est2uni. This site also provides detailed instructions for installation and configuration of the software package. The code is under active development to incorporate new analyses, methods, and algorithms as they are released by the bioinformatics community.
Figures
References
Publication types
MeSH terms
LinkOut - more resources
Full Text Sources
Research Materials
