Coordinated evolution of co-expressed gene clusters in the Drosophila transcriptome
- PMID: 18179715
- PMCID: PMC2266709
- DOI: 10.1186/1471-2148-8-2
Coordinated evolution of co-expressed gene clusters in the Drosophila transcriptome
Abstract
Background: Co-expression of genes that physically cluster together is a common characteristic of eukaryotic transcriptomes. This organization of transcriptomes suggests that coordinated evolution of gene expression for clustered genes may also be common. Clusters where expression evolution of each gene is not independent of their neighbors are important units for understanding transcriptome evolution.
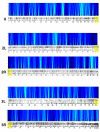
Results: We used a common microarray platform to measure gene expression in seven closely related species in the Drosophila melanogaster subgroup, accounting for confounding effects of sequence divergence. To summarize the correlation structure among genes in a chromosomal region, we analyzed the fraction of variation along the first principal component of the correlation matrix. We analyzed the correlation for blocks of consecutive genes to assess patterns of correlation that may be manifest at different scales of coordinated expression. We find that expression of physically clustered genes does evolve in a coordinated manner in many locations throughout the genome. Our analysis shows that relatively few of these clusters are near heterochromatin regions and that these clusters tend to be over-dispersed relative to the rest of the genome. This suggests that these clusters are not the byproduct of local gene clustering. We also analyzed the pattern of co-expression among neighboring genes within a single Drosophila species: D. simulans. For the co-expression clusters identified within this species, we find an under-representation of genes displaying a signature of recurrent adaptive amino acid evolution consistent with previous findings. However, clusters displaying co-evolution of expression among species are enriched for adaptively evolving genes. This finding points to a tie between adaptive sequence evolution and evolution of the transcriptome.
Conclusion: Our results demonstrate that co-evolution of expression in gene clusters is relatively common among species in the D. melanogaster subgroup. We consider the possibility that local regulation of expression in gene clusters may drive the connection between adaptive sequence and coordinated gene expression evolution.
Figures


Similar articles
-
Evolution of gene expression in the Drosophila melanogaster subgroup.Nat Genet. 2003 Feb;33(2):138-44. doi: 10.1038/ng1086. Epub 2003 Jan 27. Nat Genet. 2003. PMID: 12548287
-
Gene regulation divergence is a major contributor to the evolution of Dobzhansky-Muller incompatibilities between species of Drosophila.Mol Biol Evol. 2006 Sep;23(9):1707-14. doi: 10.1093/molbev/msl033. Epub 2006 Jun 6. Mol Biol Evol. 2006. PMID: 16757655
-
Common pattern of evolution of gene expression level and protein sequence in Drosophila.Mol Biol Evol. 2004 Jul;21(7):1308-17. doi: 10.1093/molbev/msh128. Epub 2004 Mar 19. Mol Biol Evol. 2004. PMID: 15034135
-
[Contribution of the SuUR gene to the organization of epigenetically repressed regions of Drosophila melanogaster chromosomes].Genetika. 2006 Aug;42(8):1013-28. Genetika. 2006. PMID: 17025152 Review. Russian.
-
The bithorax complex of Drosophila an exceptional Hox cluster.Curr Top Dev Biol. 2009;88:1-33. doi: 10.1016/S0070-2153(09)88001-0. Curr Top Dev Biol. 2009. PMID: 19651300 Review.
Cited by
-
Whole-genome expression plasticity across tropical and temperate Drosophila melanogaster populations from Eastern Australia.Mol Biol Evol. 2011 Jan;28(1):249-56. doi: 10.1093/molbev/msq197. Epub 2010 Jul 29. Mol Biol Evol. 2011. PMID: 20671040 Free PMC article.
-
Expression-based segmentation of the Drosophila genome.BMC Genomics. 2013 Nov 20;14:812. doi: 10.1186/1471-2164-14-812. BMC Genomics. 2013. PMID: 24256206 Free PMC article.
-
Adaptive gene expression divergence inferred from population genomics.PLoS Genet. 2007 Oct;3(10):2007-13. doi: 10.1371/journal.pgen.0030187. PLoS Genet. 2007. PMID: 17967066 Free PMC article.
-
Genomic analysis of the relationship between gene expression variation and DNA polymorphism in Drosophila simulans.Genome Biol. 2008;9(8):R125. doi: 10.1186/gb-2008-9-8-r125. Epub 2008 Aug 12. Genome Biol. 2008. PMID: 18700012 Free PMC article.
-
Homoeolog-specific retention and use in allotetraploid Arabidopsis suecica depends on parent of origin and network partners.Genome Biol. 2010;11(12):R125. doi: 10.1186/gb-2010-11-12-r125. Epub 2010 Dec 23. Genome Biol. 2010. PMID: 21182768 Free PMC article.
References
Publication types
MeSH terms
LinkOut - more resources
Full Text Sources
Molecular Biology Databases
Miscellaneous

