. 2008 Jan;82(1):100-12.
doi: 10.1016/j.ajhg.2007.09.006.

Shifting paradigm of association studies: value of rare single-nucleotide polymorphisms

Affiliations

Shifting paradigm of association studies: value of rare single-nucleotide polymorphisms

Ivan P Gorlov et al. Am J Hum Genet. 2008 Jan.

Abstract

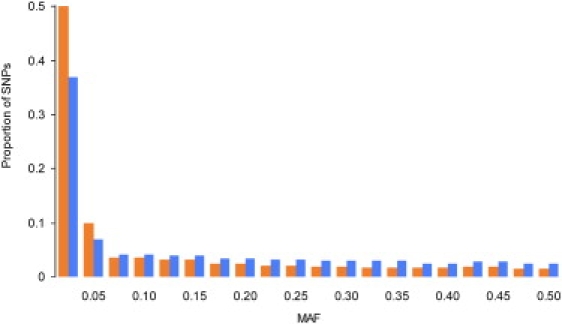
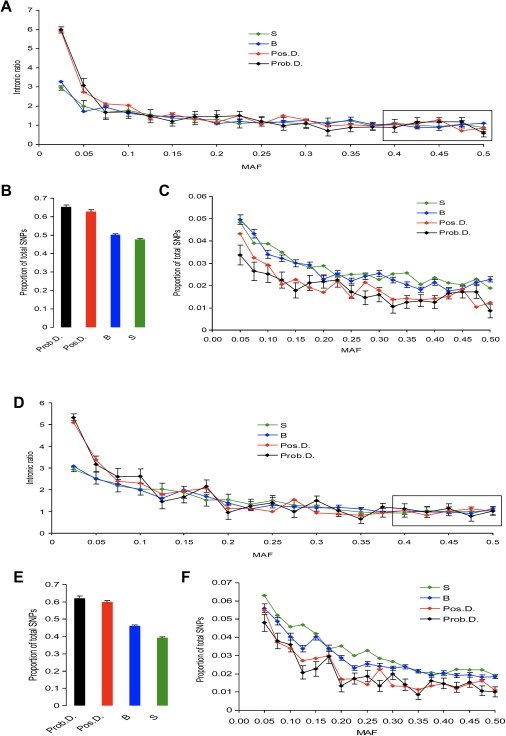
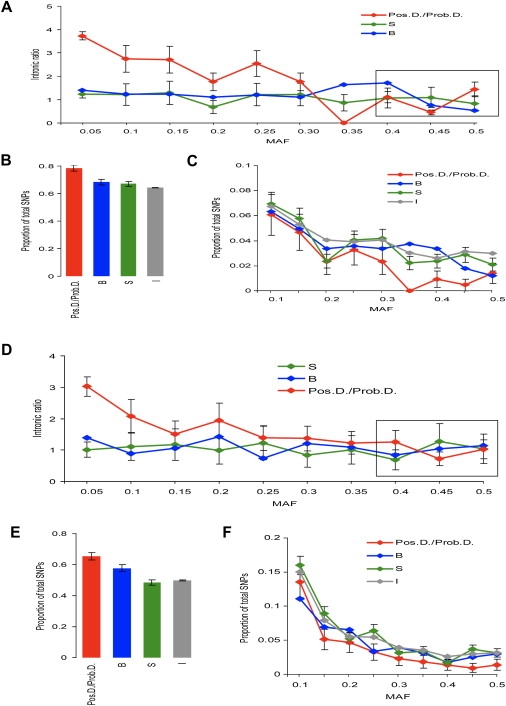
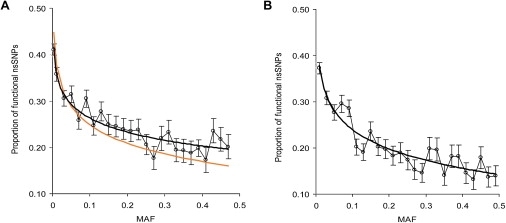
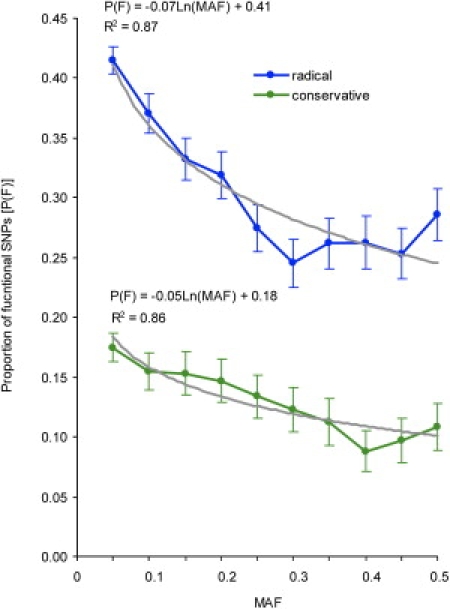
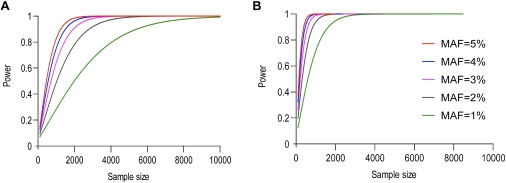
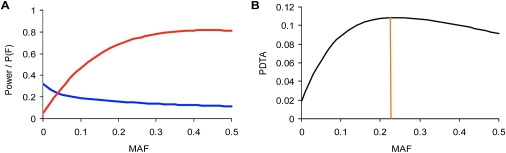
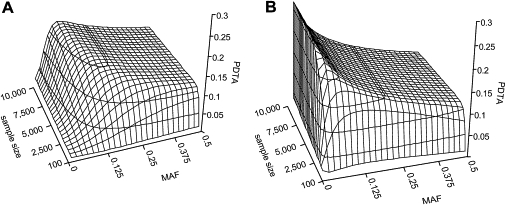
Currently, single-nucleotide polymorphisms (SNPs) with minor allele frequency (MAF) of >5% are preferentially used in case-control association studies of common human diseases. Recent technological developments enable inexpensive and accurate genotyping of a large number of SNPs in thousands of cases and controls, which can provide adequate statistical power to analyze SNPs with MAF <5%. Our purpose was to determine whether evaluating rare SNPs in case-control association studies could help identify causal SNPs for common diseases. We suggest that slightly deleterious SNPs (sdSNPs) subjected to weak purifying selection are major players in genetic control of susceptibility to common diseases. We compared the distribution of MAFs of synonymous SNPs with that of nonsynonymous SNPs (1) predicted to be benign, (2) predicted to be possibly damaging, and (3) predicted to be probably damaging by PolyPhen. Our sources of data were the International HapMap Project, ENCODE, and the SeattleSNPs project. We found that the MAF distribution of possibly and probably damaging SNPs was shifted toward rare SNPs compared with the MAF distribution of benign and synonymous SNPs that are not likely to be functional. We also found an inverse relationship between MAF and the proportion of nsSNPs predicted to be protein disturbing. On the basis of this relationship, we estimated the joint probability that a SNP is functional and would be detected as significant in a case-control study. Our analysis suggests that including rare SNPs in genotyping platforms will advance identification of causal SNPs in case-control association studies, particularly as sample sizes increase.


Figures

Figure 1
Figure 1
Distribution of SNPs from the Encyclopedia of DNA Elements and of All SNPs Reported in the International HapMap Database by Minor Allele Frequency The distribution of encyclopedia of DNA elements (orange) and all single-nucleotide polymorphisms (SNPs) reported in the International HapMap database (blue) by minor allele frequency (MAF) are shown. All SNPs regardless of their functional category were included in the analysis.
Figure 2
Figure 2
Distribution of Intronic Ratios and MAFs for Various Types of the HapMap SNPs in Coding Regions of the Human Genome: S, B, Pos.D., and Prob.D. SNPs (A)–(C) show the CEPH (Europeans) sample; (D)–(F) show the YRI (Africans) sample. (A) and (D) show intronic ratios for synonymous SNPs (S), nonsynonymous SNPs predicted to be benign (B), nsSNPs predicted to be possibly damaging (Pos.D.), and nsSNPs predicted to be probably damaging (Prob.D.). Absolute numbers of S, B, Pos.D., and Prob.D. SNPs varied drastically, thereby making direct comparisons of intronic ratios difficult. For visual clarity, we scaled the average ratios to 1 by anchoring the distributions by their rightmost parts (i.e., 0.4–0.5). Standard errors (SEs) are shown for S and Prob.D. SNPs. (B) and (E) show the distribution of SNPs with 0–0.025 MAFs. The proportion of SNPs in the 0–0.025 MAF category is shown separately because it was much greater than proportions in the other categories. MAF was portioned into 20 bins by a 2.5% step. (C) and (F) show the proportion of SNPs in MAF >0.025 categories.
Figure 3
Figure 3
Distribution of Intronic Ratios and SNPs by MAF Categories, SeattleSNPs Database (A)–(C) show European descent; (D)–(F) show African descent. (A) and (D) show intronic ratios for synonymous SNPs (S), nonsynonymous SNPs predicted to be benign (B), nsSNPs predicted to be possibly or probably damaging (Pos.D./Prob.D.). The distributions were anchored by their rightmost parts similarly as in Figure 2. SEs are shown for S and Pos.D./Prob.D. SNPs. (B) and (E) show the distribution of SNPs with 0–0.05 MAFs. Proportions of SNPs in 0–0.05 MAF category are shown separately because they were much greater than proportions in the other categories. (C) and (F) show proportions of SNPs in MAF >0.05 categories.
Figure 4
Figure 4
Proportion of Nonsynonymous Single-Nucleotide Polymorphisms Predicted to be Protein Damaging Plotted against Minor Allele Frequency Each point represents the proportion of functional nsSNPs in a given MAF category. (A) shows the proportion predicted by the PolyPhen method. Dark solid lines are the logarithmic-regression curves. The orange line is the regression curve adjusted for PolyPhen's sensitivity and specificity (see Material and Methods for details). Vertical bars represent SEs computed on the basis of the multinomial distribution. (B) shows the proportion predicted by the sorting intolerant from tolerant (SIFT) method.
Figure 5
Figure 5
Conservative versus Radical Amino Acid Substitutions Proportions of functional SNPs among radical (blue line) and conservative (green line) amino acid substitutions are shown. Vertical bars represent SEs. Predictive curves (gray) and equations are shown separately for radical and conservative substitutions.
Figure 6
Figure 6
Relationship between Statistical Power and Needed Sample Size The model shows a dominant causal single-nucleotide polymorphism with a minor allele frequency (MAF) ≤5%. (A) shows OR = 1.5, and (B) shows OR = 2.0. We used a 5% significance level. The power calculations were performed on the basis of the assumption that only one SNP is being typed (no corrections for multiple testing).
Figure 7
Figure 7
Example of Computing Probability to Detect True Association and Most Powerful Minor Allele Frequency Study of single-nucleotide polymorphisms in a dominant model of inheritance with 300 cases and 300 controls. An OR = 1.5 was assumed. In (A), the red line shows the dependence of the statistical power on minor allele frequency (MAF), and the blue line shows the predicted proportion of functional SNPs P(F), predicted by formula 1. (B) shows the dependence of PDTA on MAF. The mpMAF is marked by the vertical line, which indicates ∼0.22 in this case.
Figure 8
Figure 8
Dependence of the Probability to Detect a True Association on Minor Allele Frequency and Sample Size Equal sample sizes for cases and controls were assumed, and the total sample size is shown. OR = 1.5 in both the (A) recessive and (B) dominant models.
Figure 9
Figure 9
Predicted Dependence of Most Powerful Minor Allele Frequency on the Sample Size Recessive (blue lines) and dominant (red lines) models were assumed. The sample comprises equal numbers of cases and controls, and the total size is shown. (A) shows OR = 1.3. (B) shows OR = 1.5.

References

    1. Risch N., Merikangas K. The future of genetic studies of complex human diseases. Science. 1996;273:1516–1517. - PubMed
    1. Muller-Myhsok B., Abel L. Genetic analysis of complex diseases. Science. 1997;275:1328–1329. - PubMed
    1. Scott W.K., Pericak-Vance M.A., Haines J.L. Genetic analysis of complex diseases. Science. 1997;275:1327. - PubMed
    1. Long A.D., Grote M.N., Langley C.H. Genetic analysis of complex diseases. Science. 1997;275:1328. - PubMed
    1. The International HapMap Consortium The International HapMap Project. Nature. 2003;426:789–796. - PubMed

Publication types

LinkOut - more resources