. 2008 Jan;82(1):181-7.
doi: 10.1016/j.ajhg.2007.08.001.

Autosomal-dominant microtia linked to five tandem copies of a copy-number-variable region at chromosome 4p16

Affiliations

Autosomal-dominant microtia linked to five tandem copies of a copy-number-variable region at chromosome 4p16

Irina Balikova et al. Am J Hum Genet. 2008 Jan.

Abstract

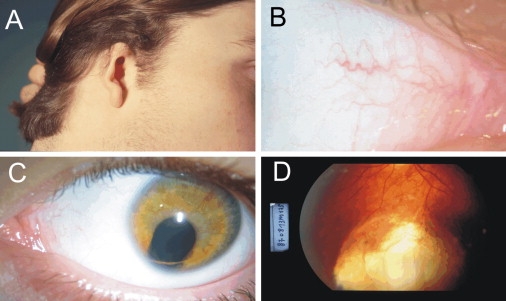
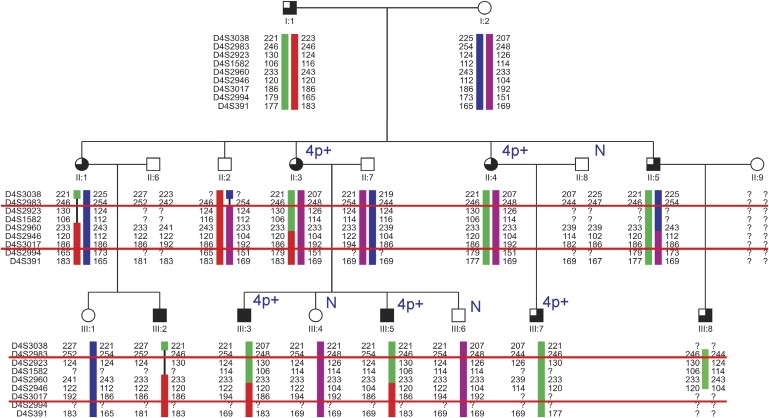
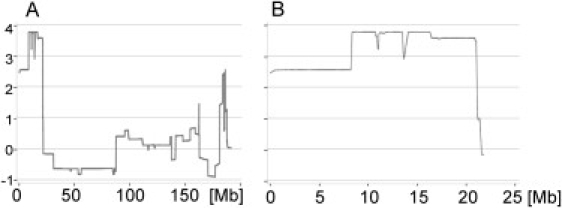
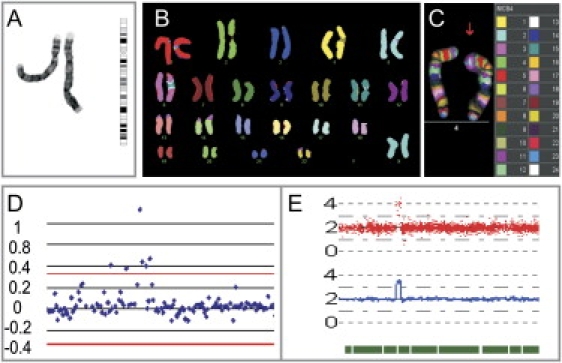
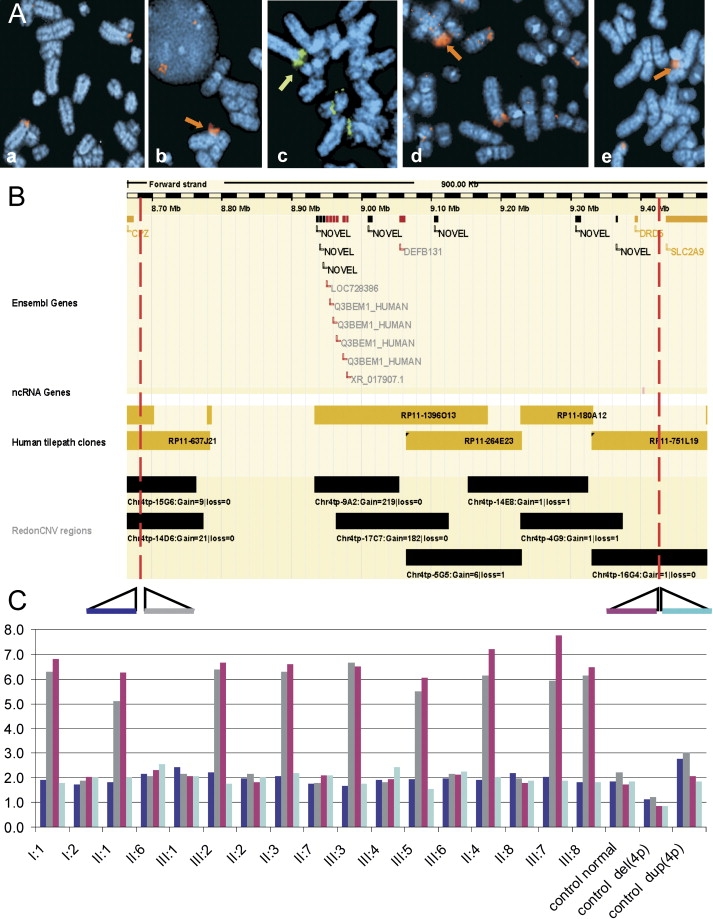
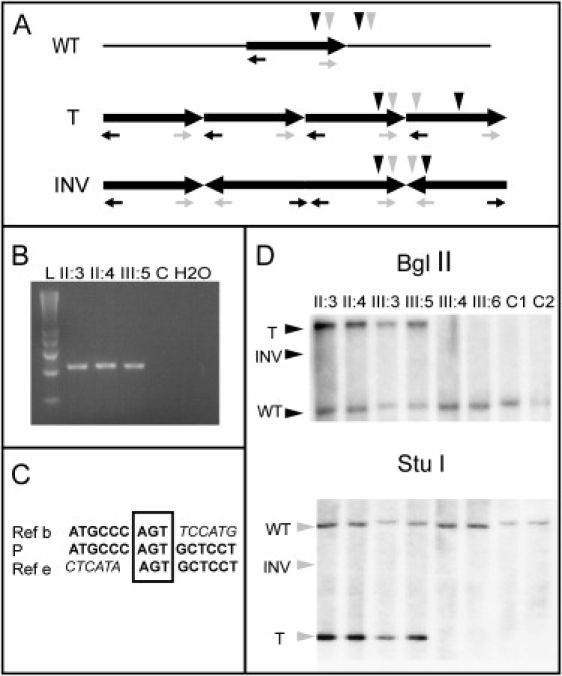
Recently, large-scale benign copy-number variations (CNVs)--encompassing over 12% of the genome and containing genes considered to be dosage tolerant for human development--were uncovered in the human population. Here we present a family with a novel autosomal-dominantly inherited syndrome characterized by microtia, eye coloboma, and imperforation of the nasolacrimal duct. This phenotype is linked to a cytogenetically visible alteration at 4pter consisting of five copies of a copy-number-variable region, encompassing a low-copy repeat (LCR)-rich sequence. We demonstrate that the approximately 750 kb amplicon occurs in exact tandem copies. This is the first example of an amplified CNV associated with a Mendelian disorder, a discovery that implies that genome screens for genetic disorders should include the analysis of so-called benign CNVs and LCRs.


Figures

Figure 1
Figure 1
Phenotype of the Patients (A) Right microtia, (B) imperforated nasolacrimal duct, (C) left-eye coloboma of the iris, and (D) chorioretinal coloboma.
Figure 2
Figure 2
Linkage of the Phenotype with 4p15-4p16.1 Primer sequences for linkage analysis were as published (GDB Human Genome Database). The region between the red lines is linked with the phenotype. Patients with eye coloboma are indicated by a filled upper-left square, patients with absent canaliculi are indicated by a filled lower-left square, and patients with microtia are indicated by filled upper- and lower-right squares. In those family members karyotyped, it is indicated whether only normal chromosomes 4 were identified (N) or an abnormal chromosome 4 was detected (4p+). No material was available from the II:9 family member.
Figure 3
Figure 3
The LOD Score for Chromosome 4 Calculated from the 250K SNP Array Analysis of the Affected and Unaffected Family Members On the x axis is shown the position on chromosome 4 in megabases (Mb); on the y axis is shown the corresponding LOD score. (A) The LOD score for the entire chromosome 4. (B) Detailed view on the region from 1–25 Mb showing the maximum LOD score of 3.1–3.79 for the region from 8.2 to 21.0 Mb.
Figure 4
Figure 4
Identification of the Aberration on Chromosome 4 (A) Partial karyotype of the patient showing the G-banded normal and aberrant chromosome 4. On the right, an ideogram of a normal chromosome 4 is presented. (B) MFISH analysis showing that only genetic material from chromosome 4 is present in the 4p+. (C) Multicolor-banding FISH shows that the chromosome 4p cytogenetic anomaly is caused by the 4p15-16 region, and the pink band is larger on the altered chromosome than on normal one. (D) Tiling-path array of chromosome 4pter demonstrates the amplification. The red line indicates the 4 × the standard deviation (SD) threshold. (E) Copy-number analysis for Genechip (CNAG) view of copy-number analysis of chromosome 4 by 250K SNP array (Genome Laboratory, Tokyo University). Red spots represent log2 ratios of the signal intensities between the sample and the references for each SNP. The blue line shows the averaged log2 ratios and the green bar the heterozygous SNPs.
Figure 5
Figure 5
Delineation of the Breakpoints of the Amplicon (A) FISH confirmation of the array CGH data and delineation of the CNV. FISH using (Aa) RP11-689P11 (not amplified), (Ab) RP11-637J21 and (Ae) RP11-751L19 (amplified at 4p16), and (Ac) RP11-264E23 and (Ad) RP11-180A12 (amplified at 4p and multiple loci scattered across the genome) is shown. (B) Ensembl view (Ensembl release 45, June 2007) for chr 4p16 (from 8.67 Mb to 9.57 Mb) showing the Ensembl genes, nc RNA genes, the tiling-path clones, and Redon CNV regions. (C) Q-PCR result showing the copy numbers of the family members and of the controls for the different primer pairs, estimated with the dCt method and p53 as a reference gene (primers 5′-CCCAAGCAATGGATGATTTGA-3′ and 5′-GAGCTTCATCTGGACCTGGGT-3′). The relative location of the primers to the amplified region is shown with colored bars. Dark blue is for the primer located at 8.6672 Mb, gray is for the one at 8.7802 Mb, purple is for the one at 9.4241 Mb, and light blue is for the one at 9.4242 Mb. The numbers indicating the family members are the same as in Figure 2. The colors in the graphic correspond to the different amplicons. The duplication control is a patient with t(4,8) with breakpoint at the ORGC region.
Figure 6
Figure 6
Analysis of the Orientation of the Fragments (A) Schematic view of the different possible alleles: wild-type (“WT”), tandem (“T”), and inverted (“INV”). The black and gray horizontal arrows indicate the reverse and the forward primer from the distal and proximal side of the amplified region, respectively. PCR with different combination of primers was performed: forward distal and reverse proximal, only the forward proximal and only the reverse distal primers. The vertical black and gray arrows show relative position of the restriction sites for BglII and StuI, respectively. (B) PCR product generated from the first combination of primers, present in the patients and not present in the control. “L” indicates ladder. (C) Sequence fragment showing the breakpoint. “Ref b” indicates reference sequence from the beginning of the amplified region, “P” (patient) indicates sequence derived from the breakpoint spanning PCR, and “Ref e” indicates reference sequence from the end of the region. The 3 nucleotide sequence homology is indicated in the box. (D) Southern-blot analysis. Genomic DNA was digested with BglII and StuI enzymes, and the fragments were detected with a PCR-generated probe (primers 5′-CTAACATACCTGCTCTCATC-3′ and 5′-CTCTGGGAGTTCAGATCATT-3′). The horizontal arrows indicate the three possible alleles: wild-type (“WT”), tandem (“T”), and inverted (“INV”). For both enzymes, a presence of the wild-type and the tandem allele in the patients and absence of an inverted allele is shown. The unaffected family members and the controls have only the wild-type allele.

References

    1. Schaffer A.A., Gupta S.K., Shriram K., Cottingham R.W., Jr. Avoiding recomputation in linkage analysis. Hum. Hered. 1994;44:225–237. - PubMed
    1. Cottingham R.W., Jr., Idury R.M., Schaffer A.A. Faster sequential genetic linkage computations. Am. J. Hum. Genet. 1993;53:252–263. - PMC - PubMed
    1. Liehr T., Weise A., Heller A., Starke H., Mrasek K., Kuechler A., Weier H.U., Claussen U. Multicolor chromosome banding (MCB) with YAC/BAC-based probes and region-specific microdissection DNA libraries. Cytogenet. Genome Res. 2002;97:43–50. - PubMed
    1. Fiegler H., Carr P., Douglas E.J., Burford D.C., Hunt S., Scott C.E., Smith J., Vetrie D., Gorman P., Tomlinson I.P. DNA microarrays for comparative genomic hybridization based on DOP-PCR amplification of BAC and PAC clones. Genes Chromosomes Cancer. 2003;36:361–374. - PubMed
    1. Vermeesch J.R., Melotte C., Froyen G., Van Vooren S., Dutta B., Maas N., Vermeulen S., Menten B., Speleman F., De Moor B. Molecular karyotyping: Array CGH quality criteria for constitutional genetic diagnosis. J. Histochem. Cytochem. 2005;53:413–422. - PubMed

Publication types