. 2008 Jan;82(1):199-207.
doi: 10.1016/j.ajhg.2007.09.011.

Disruption of neurexin 1 associated with autism spectrum disorder

Affiliations

Disruption of neurexin 1 associated with autism spectrum disorder

Hyung-Goo Kim et al. Am J Hum Genet. 2008 Jan.

Abstract

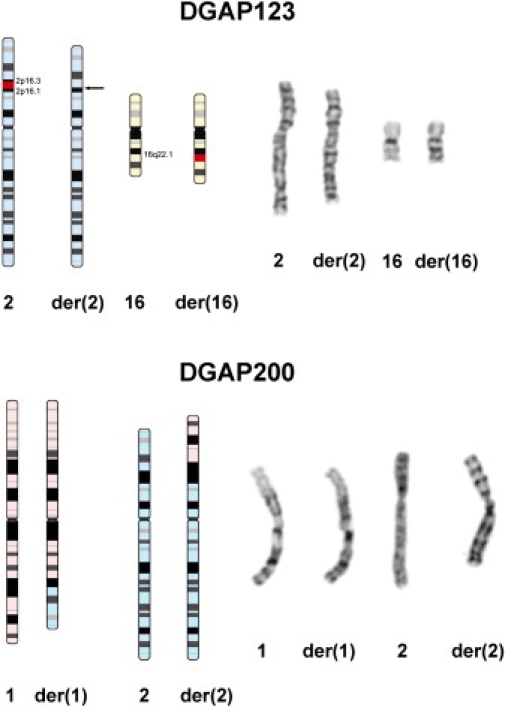
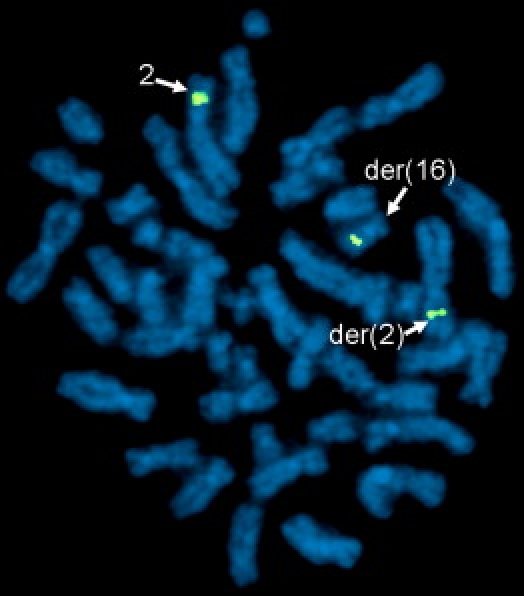
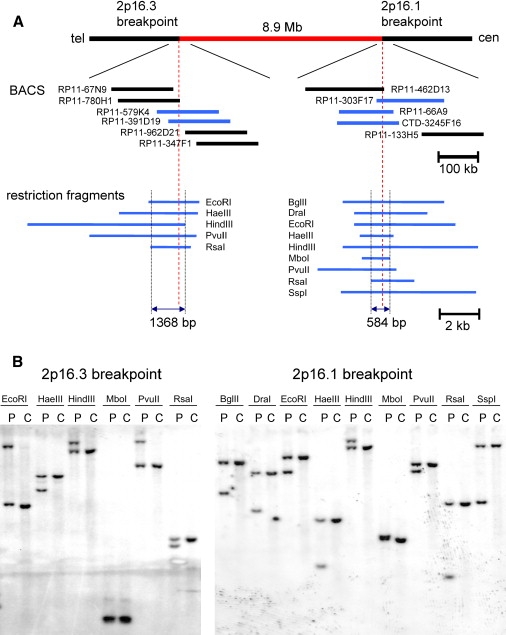
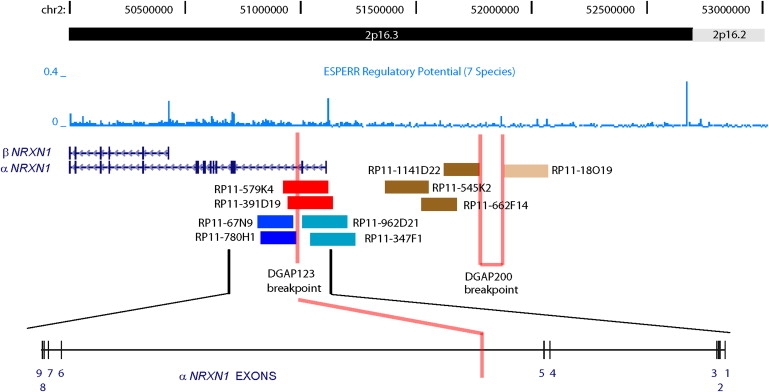
Autism is a neurodevelopmental disorder of complex etiology in which genetic factors play a major role. We have implicated the neurexin 1 (NRXN1) gene in two independent subjects who display an autism spectrum disorder (ASD) in association with a balanced chromosomal abnormality involving 2p16.3. In the first, with karyotype 46,XX,ins(16;2)(q22.1;p16.1p16.3)pat, NRXN1 is directly disrupted within intron 5. Importantly, the father possesses the same chromosomal abnormality in the absence of ASD, indicating that the interruption of alpha-NRXN1 is not fully penetrant and must interact with other factors to produce ASD. The breakpoint in the second subject, with 46,XY,t(1;2)(q31.3;p16.3)dn, occurs approximately 750 kb 5' to NRXN1 within a 2.6 Mb genomic segment that harbors no currently annotated genes. A scan of the NRXN1 coding sequence in a cohort of ASD subjects, relative to non-ASD controls, revealed that amino acid alterations in neurexin 1 are not present at high frequency in ASD. However, a number of rare sequence variants in the coding region, including two missense changes in conserved residues of the alpha-neurexin 1 leader sequence and of an epidermal growth factor (EGF)-like domain, respectively, suggest that even subtle changes in NRXN1 might contribute to susceptibility to ASD.


Figures

Figure 1
Figure 1
Balanced Chromosome Rearrangements in DGAP123 and DGAP200 The top panel shows an ideogram (excised/inserted region in red) and composite chromosomes for the DGAP123 rearrangement [46,XX,ins(16;2)(q22.1;p16.1p16.3)pat]. The bottom panel shows an ideogram and composite chromosomes for translocation in DGAP200 [46,XY,t(1;2)(q31.3;p16.3)dn].
Figure 2
Figure 2
Identification of BAC Clone Crossing the DGAP123 2p16.3 Breakpoint FISH analysis of DGAP123 with 2p16.3 BAC clone RP11-391D19 (green) shows hybridization to both the der(2) and der(16) chromosomes, indicating that the breakpoint of the insertion is located within the sequence of this genomic clone.
Figure 3
Figure 3
Mapping of the 2p16.3 and 2p16.1 Breakpoints of DGAP123 (A) The mapping of the two chromosome 2 breakpoints (dashed red vertical lines) at the edges of the 8.9 Mb of DNA (shown in red) excised and inserted into chromosome 16. Below the map schematic are BAC clones that in FISH experiments detect both der(2) and der(16) (blue lines) or only one of the derivative chromosomes (black lines). Below the BACs are shown restriction fragments used in DNA-blotting experiments (see [B]) to confine the breakpoints to small segments of 2p16.3 and 2p16.1, respectively. (B) Genomic DNA blots hybridized with probes from the 2p16.3 breakpoint region (left) and the 2p16.1 breakpoint region (right), respectively. Each lane contains genomic DNA digested with the designated restriction enzyme from either DGAP123 (P) or a normal control (C). Additional bands in the P lanes indicate novel restriction fragments generated by the interchromosomal exchange. The hybridization probes P258C and P328, which detected aberrant bands containing breakpoints at 2p16.3 and 2p16.1, respectively, were amplified using the following primer pairs: P258C: 5′-ATGTCTGATATTATAAGGTGAAACTCCGGTCTTCC-3′ and 5′-CAAGTCCTGTGTTGCTATATAGCGAATTTGTCTG-3′; P328: 5′-CTGTTTTCTTCTCTCACTATATGAGTTGAACATATACAAATAGGC-3′ and 5′-GGAAGTGGAAAGCTGCTGTTTCTCAGCCATTGCTCA-3′.
Figure 4
Figure 4
NRXN1 Region of 2p16.3 and DGAP Subject Breakpoints This schematic diagram, reworked from tracks provided by the UCSC Genome Browser, shows exon locations and transcript orientation for α-NRXN1 and the overlapping β-NRXN1, along with the upstream region devoid of known genes, below a black bar indicating 2p16.3 and base-pair locations from the telomeric side (left) toward the centromere (right). The blue graph between these shows the estimated regulatory potential (0–0.4) calculated by comparing frequencies of short alignment patterns between known regulatory elements and neutral DNA across seven species (human, chimpanzee, macaque, mouse, rat, dog, and cow). Regulatory potential is highest at the recognized α-NRXN1 and β-NRXN1 promotors and especially at an anonymous site more than 1 Mb upstream of NRXN1. Red lines indicate the position in α-NRXN1 intron 5 and approximate position upstream of NRXN1 for the DGAP123 and DGAP200 breakpoints, respectively. FISH-mapped BAC clones crossing the former are shown in red, with selected clones mapping to der(2) and der(16) shown in dark blue and teal, respectively. For the latter, FISH-mapped BAC clones mapping to der(1) and der(2) are shown in dark brown and light brown, respectively.
Figure 5
Figure 5
RT-PCR Amplification of NRXN1 mRNA from Lymphoblastoid Cells Each panel shows the results of amplification of reverse-transcribed mRNA from human brain (B) and control lymphoblastoid cells (L), with primers designed to amplify products of known size and sequence (available upon request), based upon the established brain mRNA sequences of α- and β-NRXN1. The third lane in each panel is a standard marker with band sizes in bp from smallest to largest of 100, 200, 300, 400, 500, 650, 850, and 1,000, in the relevant resolving range. Arrows indicate the expected sizes of PCR products based on known splice variants from brain. Any additional bands not marked by arrows are PCR artifacts, corroborated by DNA sequencing. The lymphoblastoid cell mRNA produced matching NRXN1 products for at least one expected splice product for each of the primer pairs Ex07-09, Ex12-14, Ex20-22 and Ex22-24 (this product is equivalent to β-NRXN1 Ex05-07), but no PCR products for Ex01-02, Ex02-07, or β-NRXN1 Ex01-05. Matching PCR products from the lymphoblastoid cell mRNA were confirmed as the expected NRXN1 products by DNA sequencing.
Figure 6
Figure 6
Expression of NRXN1 mRNA from One Allele in DGAP200 Sequence traces for a region of the 3′ UTR of NRXN1 surrounding a four-nucleotide duplication polymorphism are shown for genomic DNA (left) or RNA (right) of lymphoblastoid cells from an unaffected control (top) or DGAP200 (bottom). Both the control and DGAP200 are heterozygous for alleles containing either one or two copies, respectively, of the TTAC polymorphism described in the text, shown here as the reverse strand (GTAA). This introduces mixed sequence after the first copy of the repeat, shown above the traces. The RNA from the control line shows evidence of expression of both alleles, whereas the DGAP200 samples shows expression only of the allele containing two copies of the repeat (second copy underlined). Primers used for genomic DNA were from exon 24, as follows: F: 5′-ATAGCTCTCTGGTATTCAGTG-3′ and R: 5′-TCCAGAAATGTTCATCATG-3′, whereas those mRNA were chosen in exons 23 and 24 to ensure no interference from unspliced RNA or DNA contamination: 4nt-ins F; 5′-AGGACATTGACCCCTGTGAG-3′ and 4nt-ins R; 5′-TGCAACAGAATGAAGGCTGTA-3′. PCR products were isolated by 1% agarose gel and purified with MiniElute Gel Extraction kit (QIAGEN, Hilden, Germany). Extracted DNAs were sequenced with ABI3730XL DNA Analyzer.
Figure 7
Figure 7
Expression of Neurexin 1 in DGAP Subjects and Control Lymphoblasts (A) Lymphoblastoid whole-cell protein extracts (prepared by lysis in RIPA buffer containing protease inhibitor mixture [Roche Applied Science, Indianapolis IN], 1 mM PMSF): GUS10928 control (lane 1), DGAP123-2 (lane 2), DGAP124 (lane 3), DGAP200 (lane 4), and DGAP123 (lane 5) were probed on western blots with a C-terminal neurexin 1 antibody (top panel: P-15, Santa Cruz Biotechnology, Santa Cruz, CA, USA), preincubated without or with specific blocking peptide. These same blots were also probed with a glyceraldehyde-3-phosphate dehydrogenase (GAPDH) antibody (bottom panel: FL-335; Santa Cruz Biotechnology) so that the loading amount in each lane could be monitored. Lanes 1 and 2 represent individuals (unrelated control and mother of DGAP123, respectively) who have no cytogenetic abnormality of 2p16.3, whereas lanes 3–5 represent individuals (DGAP124, DGAP200, and DGAP123) with a 2p16.3 chromosomal abnormality. The ∼82 kDa neurexin 1 band quantitated by densitometry in (B) is indicated by an arrow. The smaller bands were not detected reproducibly or in consistent proportion relative to the largest band and could represent degradation products, alternative isoforms or cross-reacting proteins. (B) The relative band intensity of the ∼82 kDa neurexin 1 band (normalized to glyceraldehyde-3-phosphate dehydrogenase intensity and compared with either one or two different control lymphoblasts in each case) is shown as the mean band intensity (±SD) relative to control from three different experiments. The numbers correspond to the following subjects: 1, Control; 2, DGAP123-2; 3, DGAP124; 4, DGAP200; and 5, DGAP123. Significant reduction compared to control was determined by t test: p < 0.05; ∗∗p < 0.001.

Similar articles

Cited by

References

    1. Autism and Developmental Disabilities Monitoring Network Surveillance Year 2002 Principal Investigators Prevalence of autism spectrum disorders–autism and developmental disabilities monitoring network, 14 sites, United States, 2002. MMWR Surveillance Summaries. 2007;56:12–28. - PubMed
    1. Santangelo S.L., Tsatsanis K. What is known about autism: Genes, brain, and behavior. Am. J. Pharmacogenomics. 2005;5:71–92. - PubMed
    1. Grice D.E., Buxbaum J.D. The genetics of autism spectrum disorders. Neuromolecular Med. 2006;8:451–460. - PubMed
    1. Xu J., Zwaigenbaum L., Szatmari P., Scherer S.W. Molecular cytogenetics of autism. Curr. Genomics. 2004;5:347–364.
    1. Vorstman J.A., Staal W.G., van Daalen E., van Engeland H., Hochstenbach P.F., Franke L. Identification of novel autism candidate regions through analysis of reported cytogenetic abnormalities associated with autism. Mol. Psychiatry. 2006;11:18–28. - PubMed

Publication types

LinkOut - more resources