. 2008 Jan 21;205(1):169-81.
doi: 10.1084/jem.20071164. Epub 2008 Jan 7.

Mannose-binding lectin enhances Toll-like receptors 2 and 6 signaling from the phagosome

Affiliations

Mannose-binding lectin enhances Toll-like receptors 2 and 6 signaling from the phagosome

W K Eddie Ip et al. J Exp Med. .

Abstract

Innate immunity is the first-line defense against pathogens and relies on phagocytes, soluble components, and cell-surface and cytosolic pattern recognition receptors. Despite using hard-wired receptors and signaling pathways, the innate immune response demonstrates surprising specificity to different pathogens. We determined how combinatorial use of innate immune defense mechanisms defines the response. We describe a novel cooperation between a soluble component of the innate immune system, the mannose-binding lectin, and Toll-like receptor 2 that both specifies and amplifies the host response to Staphylococcus aureus. Furthermore, we demonstrate that this cooperation occurs within the phagosome, emphasizing the importance of engulfment in providing the appropriate cellular environment to facilitate the synergy between these defense pathways.


Figures
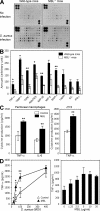
Figure 1.
Figure 1.
MBL regulates the cytokine responses upon S. aureus infection. (A) Protein array blots showing the relative amounts of specific cytokines present in the pooled serum samples obtained from wild-type (n = 3) and MBL−/− (n = 3) mice on a C57BL/6 background at 2 h after i.v. inoculation in the tail vein with 2 × 10⁷ S. aureus or saline (no infection; Fig. S1 A shows the map of the protein array). (B) Expression levels of cytokines in serum after S. aureus infection. Data are mean intensity ± SD of duplicate signals obtained from the protein array blots shown in A. (C and D) Cytokine production by peritoneal macrophages (from wild-type C57BL/6J mice) and J774 macrophages after in vitro stimulation with S. aureus. Cells were incubated with heat-inactivated S. aureus (MOI = 50 or as indicated), which were opsonized without (control) or with MBL at 10 μg/ml or the indicated concentrations. Induction of cytokine responses at 2 (TNF-α) or 4 (IL-6) h was measured by ELISA in culture supernatants. Data are representative of four independent experiments. Data indicate mean ± SD of triplicates. *, P ≤ 0.05; **, P < 0.01.
Figure 2.
Figure 2.
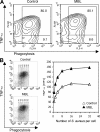
MBL enhances TNF-α response in macrophages with equivalent bacterial loads. (A) Single-cell analysis by flow cytometry determining bacterial engulfment and intracellular TNF-α production. TAMRA-labeled S. aureus, unopsonized (control) or opsonized with MBL at 10 μg/ml, were incubated with adherent C57BL/6J peritoneal macrophages at an MOI of 25 for 1–3 h. Phagocytosis and intracellular TNF-α production were measured simultaneously by flow cytometry. Contour plots show the percentages of TNF-α–producing (top) or –nonproducing (bottom) cells at 3 h after internalization of the bacteria. (B) TNF-α production in macrophages with defined bacterial loads. The number of bacteria engulfed by macrophages was estimated with the MFI obtained for a single bacterial particle. Cells that contain one- or twofold increasing numbers of bacteria were identified in regions R1–6 (density plots; left), thus allowing normalization of cytokine production for defined bacterial loads (right). Data are the MFI of intracellular TNF-α production from corresponding regions and representative of three independent experiments.
Figure 3.
Figure 3.
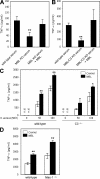
MBL enhances proinflammatory response to S. aureus independently of complement activation. (A and B) TNF-α response to S. aureus opsonized with mouse serums. C57BL/6J peritoneal macrophages were cultured in the presence of heat-inactivated S. aureus (MOI = 50), which were opsonized with wild-type serum (from wild-type mice), MBL KO serum (from MBL knockout mice; A), or MBL/C3 KO serum (from MBL × C3 knockout mice; B), or the KO serums supplemented with exogenous MBL at 20 μg/ml. TNF-α response at 2 h was measured by ELISA in culture supernatants. (C and D) TNF-α production by control (wild-type), C3−/−, or complement receptor 3−/− macrophages in response to S. aureus opsonized with or without MBL. Peritoneal macrophages from control C57BL/6J mice, C3−/− mice (C), or complement receptor 3−/− (Mac-1−/−) mice (D) were cultured in the presence of heat-inactivated S. aureus (at the indicated MOIs [C] or MOI = 50 [D]), which were opsonized without (control) or with 10 μg/ml of MBL. TNF-α response at 2 h was measured. Data are representative of two independent experiments and indicate the mean ± SD of triplicates. *, P ≤ 0.05; **, P < 0.01. n.d., no detectable cytokine.
Figure 4.
Figure 4.
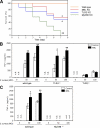
MBL up-regulates TLR2–MyD88–dependent response to S. aureus. (A) Survival of wild-type (n = 8), MBL−/− (n = 9), TLR2−/− (n = 8), and MyD88−/− (n = 7) mice on a C57BL/6 background after i.v. inoculation in the tail vein with 1.5 × 10⁷ S. aureus. (B and C) In vitro TNF-α response to S. aureus opsonized with or without MBL in control (wild-type), TLR2−/−, TLR4−/−, or MyD88−/− macrophages. Peritoneal macrophages from TLR2−/−, TLR4−/−, or control B6129PF2/J mice (B), or MyD88−/− or control C57BL/6J mice (C), were cultured in the presence of heat-inactivated S. aureus (at the indicated MOIs), which were opsonized without (control) or with 10 μg/ml of MBL. Induction of TNF-α response at 2 h was measured by ELISA in culture supernatants. Data are representative of three independent experiments and indicate the mean ± SD of triplicates. *, P ≤ 0.05; **, P < 0.01. n.d., no detectable cytokine.
Figure 5.
Figure 5.
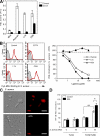
MBL recognizes S. aureus via binding to LTA and modules signaling from the TLR2/6 heterodimer. (A) MBL binding to LTA and PGN in solid phase. MBL was incubated at 10 μg/ml in microtiter plates coated with 100 μg/ml BSA, mannan, LTA, or PGN in the absence (control) or presence of EDTA for 2 h. MBL binding to the coated wells was determined by ELISA. Data are representative of at least three independent experiments and indicate the mean ± SD of triplicates. (B and C) Inhibition of MBL binding to S. aureus by LTA. Cy3-MBL at 10 μg/ml was pretreated without (control; B, left) or with 100 μg/ml LTA or PGN (B, left), or the indicated amount of mannan, LTA, or PGN (B, right), or 100 μg/ml LTA (C). Pretreated or nonpretreated Cy3-MBL at 10 μg/ml was incubated with heat-inactivated S. aureus in the presence or absence of EDTA for 30 min. Binding of Cy3-MBL (red) to the bacteria was analyzed by flow cytometry, where MBL binding was determined by MFI in the bacteria population (B), and fluorescence microscopy (C). The dashed line (B, right) indicates the binding to the bacteria by nonpretreated MBL. Bars, 5 μm. (D) NF-κB activation by S. aureus opsonized with or without MBL in HEK293 cells expressing TLR2 with or without TLR6. HEK293 cells stably expressing TLR2, cotransfected with the NF-κB reporter system, and with or without TLR6, were cultured in the presence of heat-inactivated S. aureus (MOI = 50), which were opsonized without (control) or with MBL at 10 μg/ml. Reporter gene activity at 4 h was measured by a luciferase assay system (see Materials and methods). Data are representative of two independent experiments and indicate the mean ± SD of triplicates. *, P ≤ 0.05; **, P < 0.01.
Figure 6.
Figure 6.
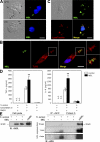
MBL traffics onto phagosomes and complexes with TLR2. (A–C) Localization of MBL on macrophage phagosomes. C57BL/6J peritoneal macrophages were incubated with Alexa Fluor 488–MBL–opsonized S. aureus for 10 min at 37 or 4°C (on ice; A), for 10 min at 37°C (B), or for 45 min at 37°C (C). Before intracellular staining for TLR2 or nuclei, cells were washed with EDTA to remove MBL from extracellular bacteria. Localization of MBL on phagosomes was shown by Alexa Fluor 488–MBL (green) on internalized bacteria (arrows), but not on noninternalized or cell surface–bound bacteria (arrowheads; A). Nuclei were stained with HOECHST (blue). Enrichment of TLR2 on phagosomes was shown by staining with anti-TLR2 (red), where TLR2s were colocalized with MBL in the merged image (B). (B, right) Images are magnifications of the insets. Localization of MBL on phagolysosome was shown in macrophages preloaded with LysoTracker (red; C). Data are representative of four independent experiments. Bars, 10 μm. (D) Requirement of phagocytosis for MBL-enhanced responses to S. aureus. C57BL/6J peritoneal macrophages were pretreated with 6 μM cytochalasin D or an equal volume of DMSO and incubated with heat-inactivated S. aureus (MOI = 100) opsonized without (control) or with 10 μg/ml MBL. Induction of cytokine responses at 2 (TNF-α) or 4 (IL-6) h was measured by ELISA in culture supernatants. Data are representative of three independent experiments and indicate the mean ± SD of triplicates. *, P ≤ 0.05; **, P < 0.01. n.d., no detectable cytokine. (E) Immunoprecipitation (IP) and immunoblot (IB) of lysates of HEK293T cells expressing TLR2, detecting association between MBL and TLR2. HEK293T cells stably expressing GFP-tagged TLR2 were transfected with TLR6 and were stimulated for 15 min with or without S. aureus (MOI = 50), which were opsonized with or without 10 μg/ml MBL. MBL was detected by the IB using anti-MBL antibody (αMBL) in the cell lysates (left) and in the immunoprecipitates of GFP-TLR2 with anti-GFP antibody (αGFP; right). 0.625 μg rhMBL was used as a control in the IB to indicate the size of a single subunit of the molecule. Proteins pulled down by protein G alone without αGFP were used as a control for the IP (see Materials and methods). The exposure time of enhanced chemiluminescence to develop the signals is indicated for the IB of the immunoprecipitates.

Similar articles

Cited by

References

    1. Hoffmann, J.A., F.C. Kafatos, C.A. Janeway, and R.A. Ezekowitz. 1999. Phylogenetic perspectives in innate immunity. Science. 284:1313–1318. - PubMed
    1. Janeway, C.A., Jr. 1989. Approaching the asymptote? Evolution and revolution in immunology. Cold Spring Harb. Symp. Quant. Biol. 54:1–13. - PubMed
    1. Janeway, C.A., Jr., and R. Medzhitov. 2002. Innate immune recognition. Annu. Rev. Immunol. 20:197–216. - PubMed
    1. Akira, S., and K. Takeda. 2004. Toll-like receptor signalling. Nat. Rev. Immunol. 4:499–511. - PubMed
    1. Underhill, D.M., and A. Ozinsky. 2002. Phagocytosis of microbes: complexity in action. Annu. Rev. Immunol. 20:825–852. - PubMed

Publication types