. 2008 Jan 14;180(1):173-86.
doi: 10.1083/jcb.200710107. Epub 2008 Jan 7.

Voltage-gated Nav channel targeting in the heart requires an ankyrin-G dependent cellular pathway

Affiliations

Voltage-gated Nav channel targeting in the heart requires an ankyrin-G dependent cellular pathway

John S Lowe et al. J Cell Biol. .

Abstract

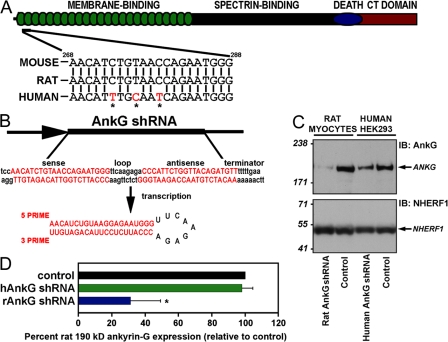
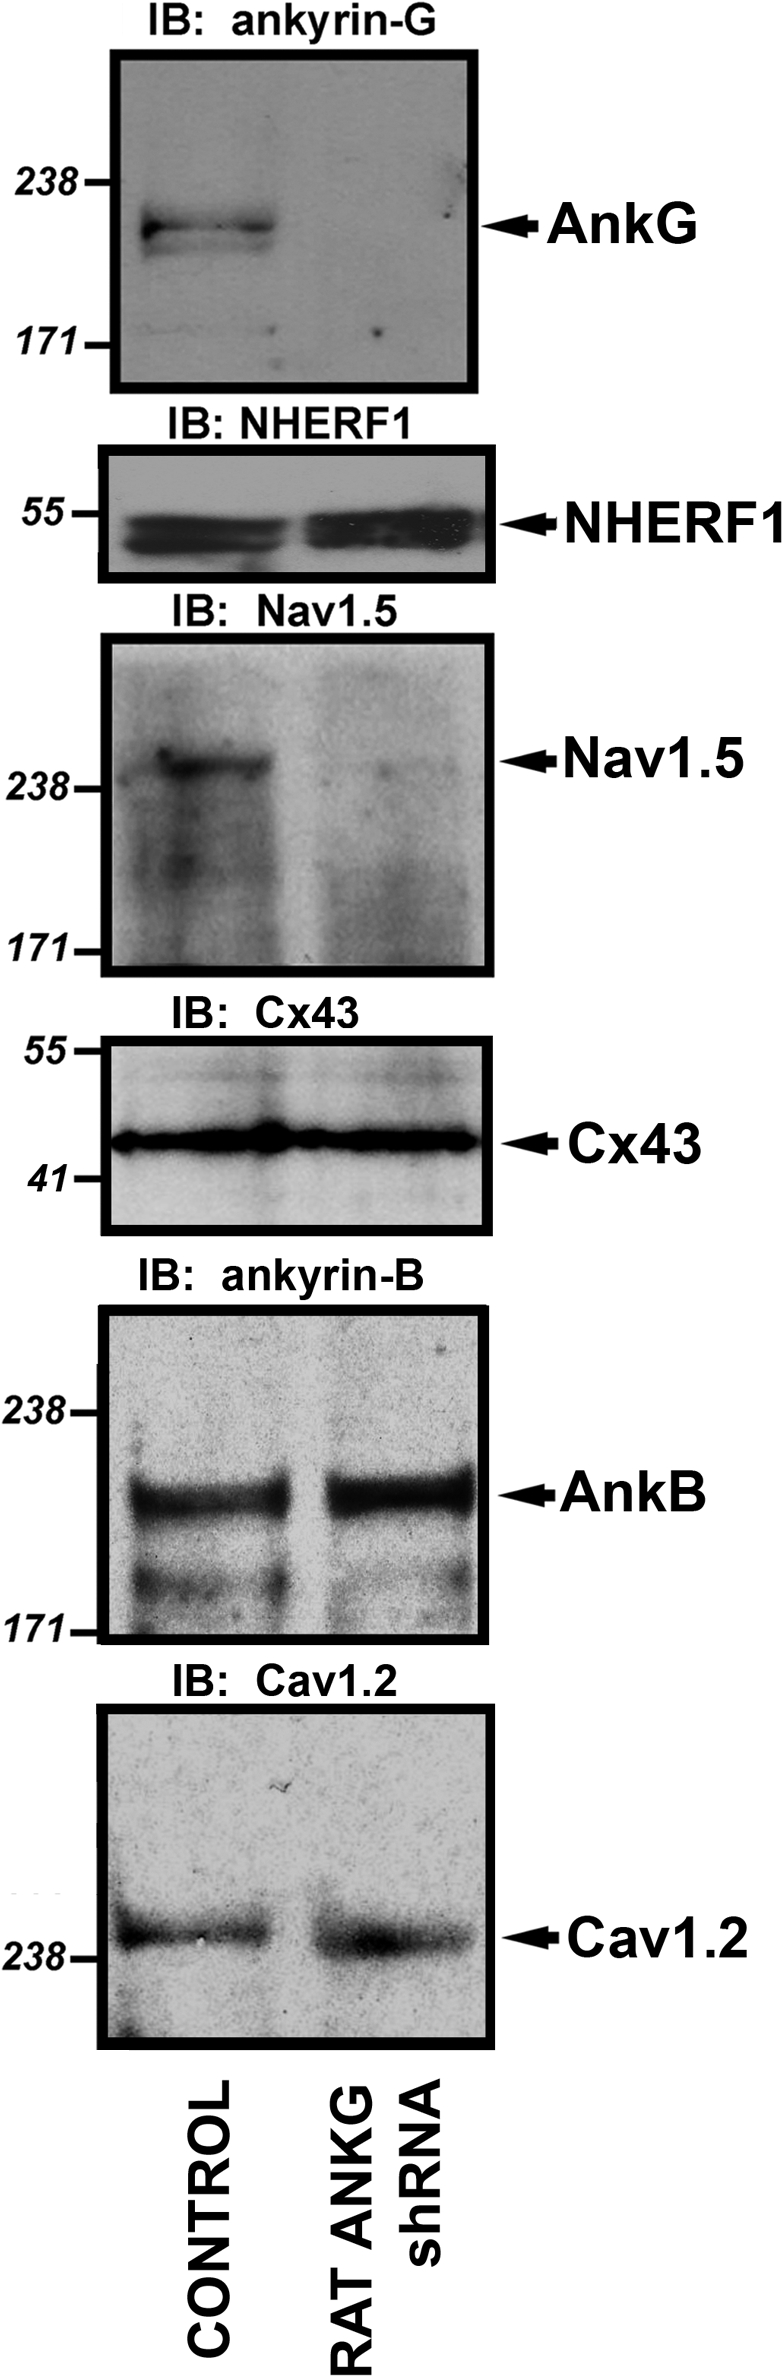
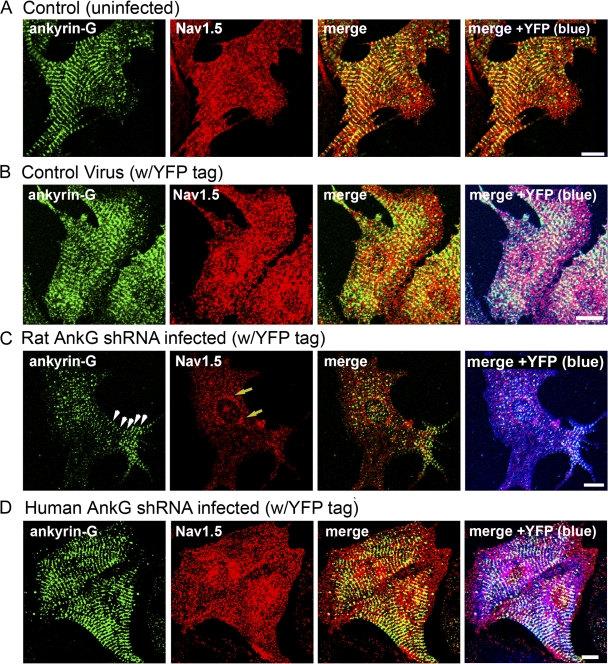
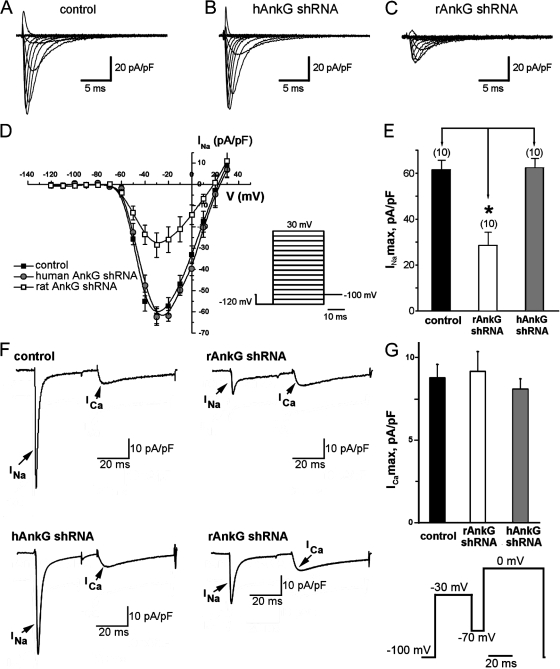
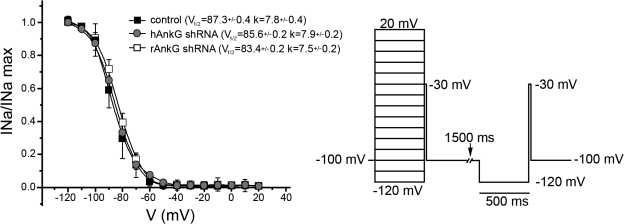
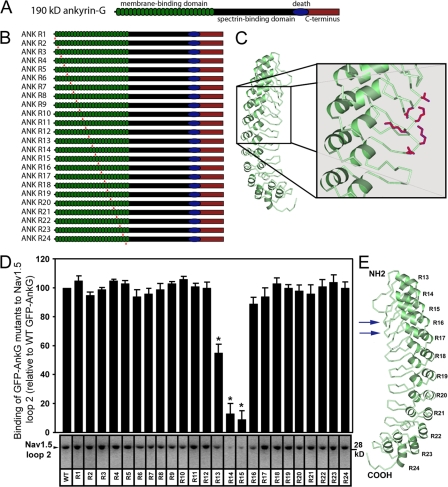
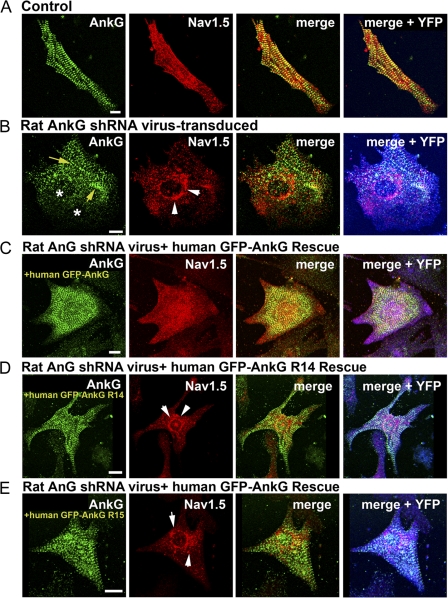
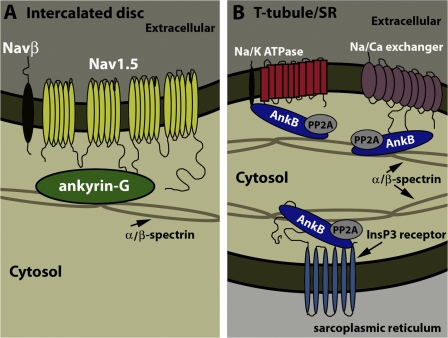
Voltage-gated Na(v) channels are required for normal electrical activity in neurons, skeletal muscle, and cardiomyocytes. In the heart, Na(v)1.5 is the predominant Na(v) channel, and Na(v)1.5-dependent activity regulates rapid upstroke of the cardiac action potential. Na(v)1.5 activity requires precise localization at specialized cardiomyocyte membrane domains. However, the molecular mechanisms underlying Na(v) channel trafficking in the heart are unknown. In this paper, we demonstrate that ankyrin-G is required for Na(v)1.5 targeting in the heart. Cardiomyocytes with reduced ankyrin-G display reduced Na(v)1.5 expression, abnormal Na(v)1.5 membrane targeting, and reduced Na(+) channel current density. We define the structural requirements on ankyrin-G for Na(v)1.5 interactions and demonstrate that loss of Na(v)1.5 targeting is caused by the loss of direct Na(v)1.5-ankyrin-G interaction. These data are the first report of a cellular pathway required for Na(v) channel trafficking in the heart and suggest that ankyrin-G is critical for cardiac depolarization and Na(v) channel organization in multiple excitable tissues.


Figures

Figure 1.
Figure 1.
Species-specific knockdown of 190-kD ankyrin-G in rat myocytes using lentiviral shRNA. (A) Domain organization of 190-kD ankyrin-G with the site of shRNA target. Rat, mouse, and human shRNA nucleotide target sequences. Note that the human 190-kD ankyrin-G target sequence has three unique nucleotides in wobble base positions (asterisks) that render this target sequence resistant to the rat shRNA. (B) The 21-nucleotide target sequence (sense) is separated by a short loop spacer sequence followed by 21 nucleotides that form the reverse complement of the target sequence. (C) Rat and human species–specific shRNAs reduce 190-kD ankyrin-G expression. Rat myocytes or human HEK293 cells were transduced with control virus, rat ankyrin-G shRNA, or human ankyrin-G shRNA. Equal quantities of protein were analyzed by immunoblotting using affinity-purified ankyrin-G Ig or an antibody to an unrelated protein, NHERF1 (loading control). Note that the rat-specific ankyrin-G shRNA effectively reduces the expression of 190-kD ankyrin-G in rat cardiomyocytes. Moreover, the expression of 190-kD ankyrin-G is reduced in HEK293 cells transduced with human-specific ankyrin-G shRNA. (D) 190-kD ankyrin-G protein levels from whole cell lysates of rat cardiomyocytes transduced with control virus, human-specific ankyrin-G shRNA virus (hAnkG shRNA), or rat-specific ankyrin-G shRNA virus (rAnkG shRNA) were analyzed by immunoblotting and quantitated. Numbers represent the mean ± SD (error bars) from four independent experiments. *, P < 0.05.
Figure 2.
Figure 2.
Nav1.5 expression is reduced in rat myocytes with reduced ankyrin-G expression. Neonatal cardiomyocytes were transduced with rat-specific ankyrin-G shRNA virus. After 22 h, myocytes were collected, and whole cell lysates were generated. Equal protein concentrations were analyzed by immunoblot using affinity-purified ankyrin-G Ig and Nav1.5-specific antibody. In parallel, blots were probed with an unrelated Ig to ensure equal protein loading (NHERF1). Note that loss of 190-kD ankyrin-G expression in myocytes transduced with rat-specific ankyrin-G shRNA was paralleled by a significant reduction in Nav1.5 expression. Reduced ankyrin-G expression did not affect the expression of ankyrin-B, connexin43, or Cav1.2. Molecular masses are expressed in kilodaltons.
Figure 3.
Figure 3.
Nav1.5 expression is reduced in single rat myocytes with reduced ankyrin-G expression. (A–D) Control myocytes (uninfected; A) and cardiomyocytes transduced with control virus (YFP alone; B), rat-specific ankyrin-G shRNA virus (C), or human-specific ankyrin-G shRNA virus (D) were immunolabeled with ankyrin-G and Nav1.5-specific antibodies and imaged using identical confocal settings. Viral transduction was assessed by the presence of YFP fluorescence (pseudocolored in blue in B–D for clarity). Note that only myocytes infected with rat-specific ankyrin-G shRNA virus displayed reduced ankyrin-G expression. These myocytes consistently displayed a decreased expression of Nav1.5. In fact, Nav1.5 expression in myocytes with reduced ankyrin-G expression (arrowheads in C) was limited to the perinuclear region (arrows in C). Bars, 10 μm.
Figure 4.
Figure 4.
Nav1.5 is normally expressed in cardiomyocytes with reduced ankyrin-B expression. Immunolocalization of ankyrin-B and Nav1.5 in neonatal myocytes derived from wild-type (A), ankyrin-B+/− (B), and ankyrin-B−/− mice (C). Note that although ankyrin-B levels are reduced ∼50% in ankyrin-B+/− myocytes and nearly 100% in ankyrin-B−/− cardiomyocytes, there is no reduction in Nav1.5 expression/localization. Bars, 10 μm.
Figure 5.
Figure 5.
Reduced sodium current amplitude and current-voltage kinetics in myocytes with reduced ankyrin-G expression. Nontransduced cardiomyocytes (control) and cardiomyocytes transduced with human- (hAnkG) or rat-specific (rAnkG) shRNA virus were analyzed for Nav1.5 current. (A–C) Whole-cell patch clamp sodium current traces elicited control (A; 17 pF), human ankyrin-G–specific shRNA–transduced cells (B; 18 pF), and rat-specific ankyrin-G shRNA–transduced cells (C; 16.8 pF). All cardiomyocytes displayed similar cell capacitance, and all traces are normalized for cell capacitance. (D) Mean and normalized current-voltage relationship for neonatal rat ventricular cardiomyocytes treated with control virus (black squares; n = 10), human ankyrin-G shRNA virus (gray circles; n = 10), and rat ankyrin-G shRNA virus (white squares; n = 10). (E) Normalized maximum sodium current amplitude in myocytes treated with control (black bar) and rat- (white bar) and human (gray bar)-specific ankyrin-G shRNA virus. *, P < 0.05. (F and G) Reduced ankyrin-G expression specifically affects cardiomyocyte sodium current. (F) Amplitude of Na+ and Ca2+ current in nontransduced (control) and rat neonatal cardiomyocytes transduced with ankyrin-G species-specific shRNA viruses. Currents are elicited with the protocol shown in the inset (see Materials and methods for details). Left panels depict Na+ and Ca2+ current in cardiomyocytes treated with control or human ankyrin-G–specific shRNA virus (hAnkG shRNA). Right panels display the significant decrease in INa, but not ICa, in cardiomyocytes transduced with rat-specific ankyrin-G shRNA virus (rAnkG shRNA). All traces are normalized for cell capacitance. (G) Reduced ankyrin-G expression leads to reduced INa but does not affect cardiomyocyte ICa. (E and G) Data are plotted as mean ± SEM (error bars; n = 10). Statistical difference was analyzed by analysis of variance.
Figure 6.
Figure 6.
Reduced ankyrin-G expression does not affect Nav1.5 inactivation in primary cardiomyocytes. Superimposed Nav1.5 inactivation curves obtained from neonatal rat cardiomyocytes treated with control (black squares) and species-specific (human, gray circles; rat, white squares) ankyrin-G shRNA viruses. The normalized INa plotted against preconditioning pulse potential was fitted using a Boltzmann equation. Voltage-dependent steady-state inactivation was determined using a paired two-pulse protocol. Each conditioning voltage is paired with a control after 1.5 s. A 500-ms conditioning pulse from −120 to 20 mV in 10-mV increments was followed by a test pulse to −30 mV. The test pulse in each series is separated from the conditioning pulse by a 2-ms interval to −120 mV. Each point (INa) is normalized against the amplitude of corresponding control pulse (INamax). Each point represents mean ± SEM (error bars; n = 5).
Figure 7.
Figure 7.
Direct interaction of ankyrin-G with Nav1.5 requires two ANK repeat β-hairpin loop tips on the ankyrin-G membrane–binding domain. (A) 190-kD ankyrin-G includes a membrane-binding domain comprised of 24 consecutive ANK repeats (green), a spectrin-binding domain (black), a death domain (blue), and a C-terminal domain (red). (B) ANK repeat mutants were engineered in the context of full-length GFP 190-kD ankyrin-G and display alanine substitutions for the two residues located at the tip of each ANK repeat β-hairpin loop (red arrowheads in B and purple sites in C). (C) Crystal structure diagram of membrane-binding domain ANK repeats 13–24 (Michaely et al., 2002). Exposed charged residues on β-hairpin loop tips (sites of alanine mutagenesis) are colored in purple. (D) Relative binding (compared with wild-type GFP 190-kD ankyrin-G) of GFP 190-kD ankyrin-G ANK repeat mutants with purified Nav1.5 DII–DIII cytoplasmic domain (n = 3; *, P < 0.05). Binding levels are corrected for the relative expression of each GFP–ankyrin-G mutant. Error bars represent SEM. (E) Nav1.5 binding sites (arrows) superimposed on the deduced crystal structure of the ankyrin-G membrane–binding domain (ANK repeats 13–24). Ankyrin-G membrane–binding domain structure is based on the crystal structure of ANK repeats 13–24 of ankyrin-R (Michaely et al., 2002).
Figure 8.
Figure 8.
Nav1.5 targeting requires direct interaction with 190-kD ankyrin-G. (A and B) Immunolocalization of ankyrin-G and Nav1.5 in control (nontransduced) and rat ankyrin-G shRNA virally transduced neonatal cardiomyocytes. Note the localization of Nav1.5 in the perinuclear region of shRNA-transduced myocytes (white arrows). Yellow arrows denote remaining ankyrin-G staining in transduced myocytes, and asterisks mark sites of complete knockdown. Virally transduced myocytes in the figure are denoted by positive YFP fluorescence (pseudocolored in blue). (C) Cardiomyocytes expressing rat-specific ankyrin-G shRNA (note the blue color denoting YFP expression) were transfected with GFP-labeled human ankyrin-G cDNA and immunolabeled with Nav1.5 and ankyrin-G antibodies. Note that human GFP–ankyrin-G restores the localization of Nav1.5 to normal (compare Nav1.5 in B and C). (D and E) GFP-human ankyrin-G mutants (R14 and R15) that lack binding activity for Nav1.5 (see Fig. 6) are unable to rescue to normal the aberrant localization of Nav1.5 (note perinuclear distribution; arrows) in myocytes stably transduced with rat ankyrin-G shRNA (note positive YFP fluorescence). Bars, 10 μm.
Figure 9.
Figure 9.
Ankyrin-G and ankyrin-B ion channel/transporter complexes in the heart. (A) Ankyrin-G is required for the targeting of Nav1.5 to the cardiomyocyte intercalated disc. Although other Nav1.5-interacting proteins have been identified, it is not yet clear whether these are present in the ankyrin-G–dependent protein complex. (B) Ankyrin-B is required for the targeting of Na/Ca exchanger and Na/K ATPase to transverse tubule membranes in the heart. InsP3 receptor targeting to the sarcoplasmic reticulum membrane requires direct interaction with ankyrin-B. Cardiac ankyrin-B protein partners also include PP2A and β2-spectrin.
Figure 10.
Figure 10.
Nav1.5 is clustered at the cardiomyocyte membrane surface with ankyrin-G. Immunogold electron microscopy of adult rat ventricular cardiomyocyte plasma membrane sheets. Anti–ankyrin-G Ig particles (10 nm gold) and anti-Nav1.5 Ig particles (5 nm gold; arrows) are found in clusters at the plasma membrane. The majority of Nav1.5-positive gold particles were clustered in proximity (<10 nm) to ankyrin-G–positive gold particles (see A, B, and D–F). However, we also observed a small fraction of Nav1.5-positive particles that were physically isolated from ankyrin-G (C). Membrane sheets labeled with gold-conjugated secondary antibodies (negative control) were clear of any gold particles (not depicted). Bar, 50 nm.

Comment in

References

    1. Abriel, H., and R.S. Kass. 2005. Regulation of the voltage-gated cardiac sodium channel Nav1.5 by interacting proteins. Trends Cardiovasc. Med. 15:35–40. - PubMed
    1. Anderson, C.L., B.P. Delisle, B.D. Anson, J.A. Kilby, M.L. Will, D.J. Tester, Q. Gong, Z. Zhou, M.J. Ackerman, and C.T. January. 2006. Most LQT2 mutations reduce Kv11.1 (hERG) current by a class 2 (trafficking-deficient) mechanism. Circulation. 113:365–373. - PubMed
    1. Bagnato, P., V. Barone, E. Giacomello, D. Rossi, and V. Sorrentino. 2003. Binding of an ankyrin-1 isoform to obscurin suggests a molecular link between the sarcoplasmic reticulum and myofibrils in striated muscles. J. Cell Biol. 160:245–253. - PMC - PubMed
    1. Ballester, L.Y., D.W. Benson, B. Wong, I.H. Law, K.D. Mathews, C.G. Vanoye, and A.L. George Jr. 2006. Trafficking-competent and trafficking-defective KCNJ2 mutations in Andersen syndrome. Hum. Mutat. 27:388. - PubMed
    1. Barry, D.M., J.S. Trimmer, J.P. Merlie, and J.M. Nerbonne. 1995. Differential expression of voltage-gated K+ channel subunits in adult rat heart. Relation to functional K+ channels? Circ. Res. 77:361–369. - PubMed

Publication types

MeSH terms