

Addressing the health benefits and risks, involving vitamin D or skin cancer, of increased sun exposure
- PMID: 18180454
- PMCID: PMC2206594
- DOI: 10.1073/pnas.0710615105
Addressing the health benefits and risks, involving vitamin D or skin cancer, of increased sun exposure
Abstract
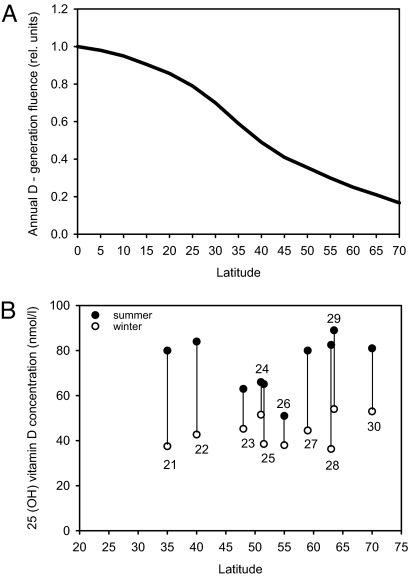
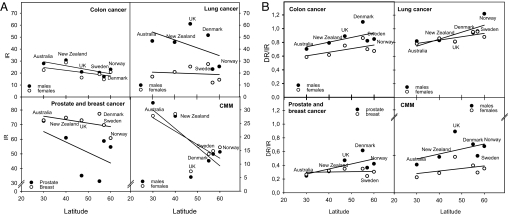
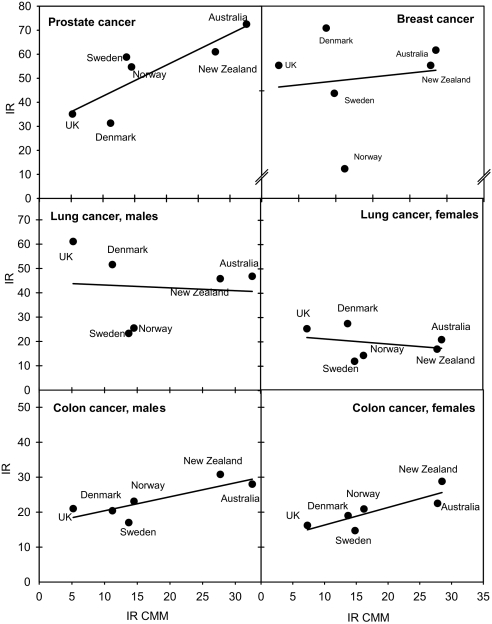
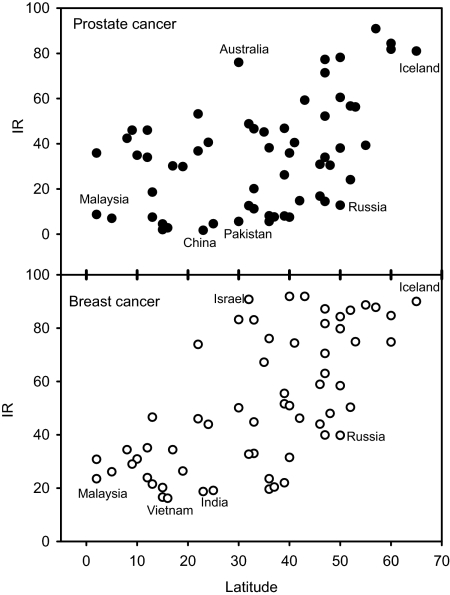
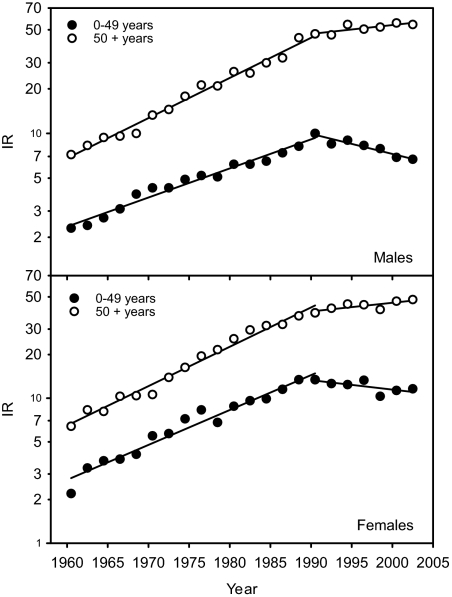
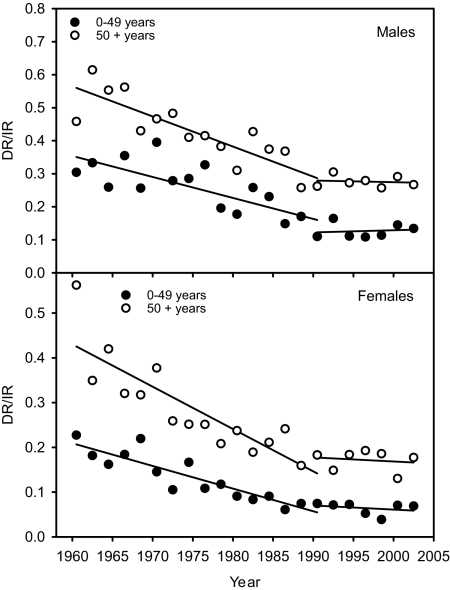
Solar radiation is the main cause of skin cancers. However, it also is a main source of vitamin D for humans. Because the optimal status of vitamin D protects against internal cancers and a number of other diseases, a controversy exists: Will increased sun exposure lead to net health benefits or risks? We calculated the relative yield of vitamin D photosynthesis as a function of latitude with a radiative transfer model and cylinder geometry for the human skin surface. The annual yield of vitamin D is 3.4 and 4.8 times larger below the equator than in the U.K. and Scandinavia, respectively. In populations with similar skin types, there are clear latitude gradients of all major forms of skin cancer, indicating a north-south gradient in real sun exposure. Surprisingly, the incidence rates of major internal cancers also increase from north to south. However, the survival prognosis also improves significantly from north to south. Reasons for these findings are discussed in view of the role of vitamin D. In Norway, melanoma rates increased by a factor of 6 from 1960 to 1990, while the prognosis improved in the same period. After 1990, melanoma rates have remained constant or even decreased in age groups <50 years, whereas the prognosis has not improved further. These data, together with those for internal cancers and the beneficial effects of an optimal vitamin D status, indicate that increased sun exposure may lead to improved cancer prognosis and, possibly, give more positive than adverse health effects.
Conflict of interest statement
The authors declare no conflict of interest.
Figures
References
-
- Diffey B. Do we need a revised public health policy on sun exposure? Br J Dermatol. 2006;154:1046–1051. - PubMed
-
- Gillie O. A new government policy is needed for sunlight and vitamin D. Br J Dermatol. 2006;154:1052–1061. - PubMed
-
- Garbe C, Eigentler TK. Diagnosis and treatment of cutaneous melanoma: State of the art 2006. Melanoma Res. 2007;17:117–127. - PubMed
-
- Cummins DL, et al. Cutaneous malignant melanoma. Mayo Clin Proc. 2006;81:500–507. - PubMed
-
- Bouillon R, et al. Vitamin D, cancer. J Steroid Biochem Mol Biol. 2006;102:156–162. - PubMed
Publication types
MeSH terms
Substances
LinkOut - more resources
Full Text Sources
Other Literature Sources
Medical
