. 2008 Jan 15;105(2):692-7.
doi: 10.1073/pnas.0707270105. Epub 2008 Jan 7.

Signaling networks assembled by oncogenic EGFR and c-Met

Affiliations

Signaling networks assembled by oncogenic EGFR and c-Met

Ailan Guo et al. Proc Natl Acad Sci U S A. .

Abstract

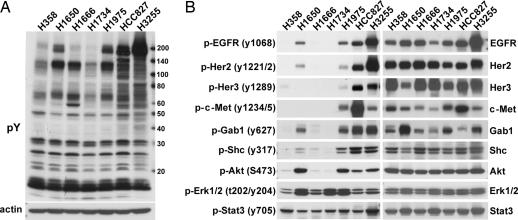
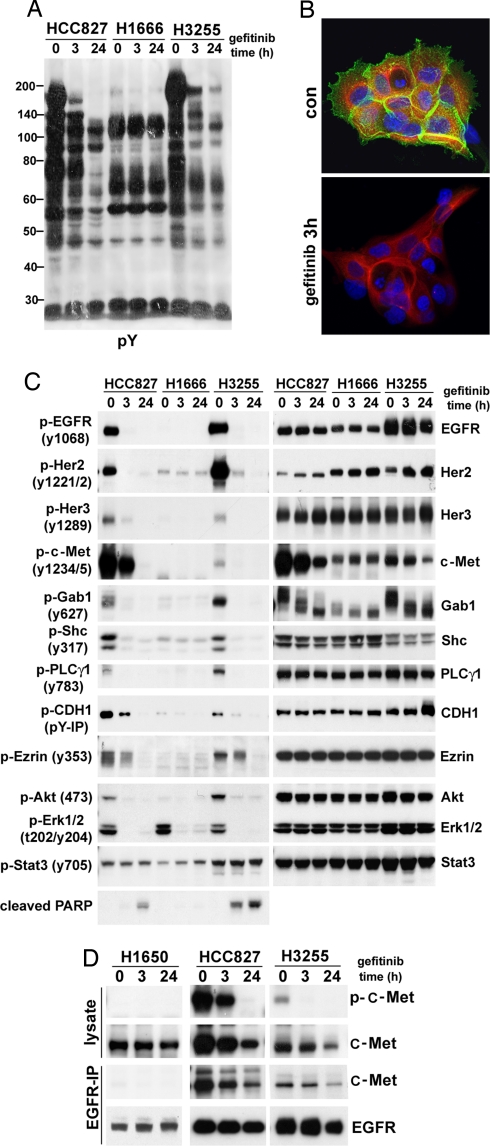
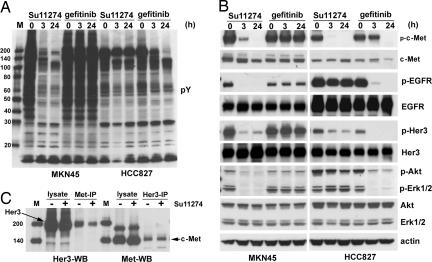
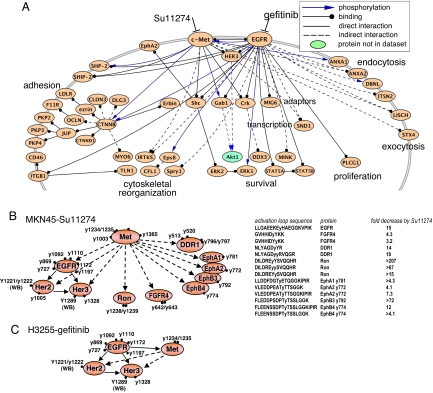
A major question regarding the sensitivity of solid tumors to targeted kinase inhibitors is why some tumors respond and others do not. The observation that many tumors express EGF receptor (EGFR), yet only a small subset with EGFR-activating mutations respond clinically to EGFR inhibitors (EGFRIs), suggests that responsive tumors uniquely depend on EGFR signaling for their survival. The nature of this dependence is not understood. Here, we investigate dependence on EGFR signaling by comparing non-small-cell lung cancer cell lines driven by EGFR-activating mutations and genomic amplifications using a global proteomic analysis of phospho-tyrosine signaling. We identify an extensive receptor tyrosine kinase signaling network established in cells expressing mutated and activated EGFR or expressing amplified c-Met. We show that in drug sensitive cells the targeted tyrosine kinase drives other RTKs and an extensive network of downstream signaling that collapse with drug treatment. Comparison of the signaling networks in EGFR and c-Met-dependent cells identify a "core network" of approximately 50 proteins that participate in pathways mediating drug response.


Conflict of interest statement

The authors declare no conflict of interest.

Figures

Fig. 1.
Fig. 1.
Comparison of phosphotyrosine signaling among EGFRI-sensitive and -resistant cell lines. (A) Western blot analysis of phospho-tyrosine (pY) signaling in serum-starved NSCLC cell lines. (B) Western blot confirmation of specific signaling molecules and selected phosphorylation sites identified by PhosphoScan experiments.
Fig. 2.
Fig. 2.
Western blot analysis confirms PhosphoScan-SILAC results. Cells were serum-starved overnight and then treated with 1 μM gefitinib for 3 or 24 h. (A) Phospho-tyrosine Western blot analysis of HCC827, H1666, and H3255 cells treated with gefitinib. (B) Immunofluorescence staining using a phosphotyrosine antibody shows membrane and cytoskeleton staining in H3255 cells that is reduced by 3-h gefitinib (1 μM) treatment. Green shows p-Tyr antibody staining, red shows β-tubulin antibody staining, and blue shows staining of nucleus. (C) The effect of gefitinib (1 μM) on selected phosphorylation sites and protein levels in HCC827, H1666, and H3255 cells. (D) Coimmunoprecipitation reveals association of Met and EGFR in gefitinib-sensitive cell lines HCC827 and H3255.
Fig. 3.
Fig. 3.
The sensitivity of MKN45 cells to tyrosine kinase inhibitors correlates with extensive changes in tyrosine phosphorylation. MKN45 and HCC827 cells were serum-starved overnight, treated with 1 μM Su11274 or 1 μM gefitinib for 3 or 24 h, respectively. (A) Phosphotyrosine Western blot analysis of MKN45 and HCC827 cells treated with Su11274 and gefitinib. (B) The effects of Su11274 and gefitinib on selected phosphorylation sites and proteins in MK45 cells (Left) and HCC827 cells (Right). (C) Coimmunoprecipitation and Western blot analysis of c-Met and Her3 association in MKN45 cells. M indicates the protein marker lane.
Fig. 4.
Fig. 4.
Regulatory networks sensitive to tyrosine kinase inhibitors in H3255 and MKN45 cells revealed by PhosphpScan-SILAC study. (A) Core signaling molecules inhibited by both gefitinib in H3255 cells and Su11274 in MKN45 cells. The proteins indicated show at least one phosphotyrosine site reduced >2.5-fold at 3 h of drug treatment. Signaling pathway connections are from PhosphoSite (31), with additional protein–protein interactions extracted from PROTEOME. (B) RTK networks revealed by PhosphoScan-SILAC in MKN45 cells (Left). Receptor tyrosine kinase activation loop tyrosine sites inhibited by Su11274 in MKN45 cells (Right). (C) RTK networks revealed by PhosphoScan-SILAC in H3255 cells. In B and C, WB indicates the sites identified by Western blot analysis. All other sites are from PhosphoScan-SILAC study. Solid arrow, known interaction; dashed arrow, predicted interaction.

References

    1. Lynch TJ, Bell DW, Sordella R, Gurubhagavatula S, Okimoto RA, Brannigan BW, Harris PL, Haserlat SM, Supko JG, Haluska FG, et al. N Engl J Med. 2004;350:2129–2139. - PubMed
    1. Paez JG, Janne PA, Lee JC, Tracy S, Greulich H, Gabriel S, Herman P, Kaye FJ, Lindeman N, Boggon TJ, et al. Science. 2004;304:1497–1500. - PubMed
    1. Pao W, Miller V, Zakowski M, Doherty J, Politi K, Sarkaria I, Singh B, Heelan R, Rusch V, Fulton L, et al. Proc Natl Acad Sci USA. 2004;101:13306–13311. - PMC - PubMed
    1. Smolen GA, Sordella R, Muir B, Mohapatra G, Barmettler A, Archibald H, Kim WJ, Okimoto RA, Bell DW, Sgroi DC, et al. Proc Natl Acad Sci USA. 2006;103:2316–2321. - PMC - PubMed
    1. Riely GJ, Politi KA, Miller VA, Pao W. Clin Cancer Res. 2006;12:7232–7241. - PubMed

Publication types

MeSH terms