. 2008 Apr;73(4):1168-84.
doi: 10.1124/mol.107.042697. Epub 2008 Jan 8.

OSU-03012 stimulates PKR-like endoplasmic reticulum-dependent increases in 70-kDa heat shock protein expression, attenuating its lethal actions in transformed cells

Affiliations

OSU-03012 stimulates PKR-like endoplasmic reticulum-dependent increases in 70-kDa heat shock protein expression, attenuating its lethal actions in transformed cells

Margaret A Park et al. Mol Pharmacol. 2008 Apr.

Abstract

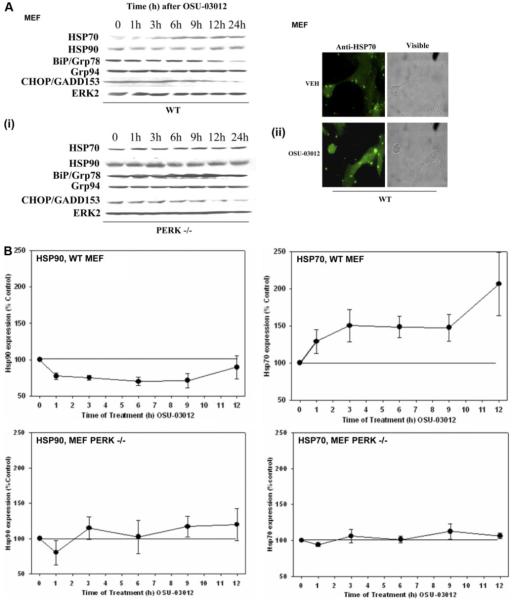
We have further defined mechanism(s) by which 2-amino-N-{4-[5-(2-phenanthrenyl)-3-(trifluoromethyl)-1H-pyrazol-1-yl]-phenyl}acetamide [OSU-03012 (OSU)], a derivative of the cyclooxygenase-2 (COX2) inhibitor celecoxib but lacking COX2 inhibitory activity, kills transformed cells. In cells lacking expression of protein kinase R-like endoplasmic reticulum kinase (PERK(-/-)), the lethality of OSU was attenuated. OSU enhanced the expression of Beclin 1 and ATG5 and cleavage of pro-caspase 4 in a PERK-dependent fashion and promoted the Beclin 1- and ATG5-dependent formation of vacuoles containing LC3, followed by a subsequent caspase 4-dependent cleavage of cathepsin B and a cathepsin B-dependent formation of low pH intracellular vesicles; cathepsin B was activated and released into the cytosol and genetic suppression of caspase 4, cathepsin B, or apoptosis-inducing factor function significantly suppressed cell killing. In parallel, OSU caused PERK-dependent increases in 70-kDa heat shock protein (HSP70) expression and decreases in 90-kDa heat shock protein (HSP90) and Grp78/BiP expression. Changes in HSP70 expression were post-transcriptional. Knock-down or small-molecule inhibition of HSP70 expression enhanced OSU toxicity, and overexpression of HSP70 suppressed OSU-induced low pH vesicle formation and lethality. Our data demonstrate that OSU-03012 causes cell killing that is dependent on PERK-induced activation of multiple toxic proteases. OSU-03012 also increased expression of HSP70 in a PERK-dependent fashion, providing support for the contention that OSU-03012-induced PERK signaling promotes both cell survival and cell death processes.


Figures

Fig. 1
Fig. 1
OSU-03012 toxicity in transformed cells is mediated in part via cathepsin B-BID-AIF signaling. A, HCT116 cells were transiently transfected as described under Materials and Methods 24 h after plating with either a scrambled siRNA (siSCR) or an siRNA against AIF (siAIF) (12). Forty-eight hours after transfection, cells were treated with the pan-caspase inhibitor zVAD (50 μM); 30 min later, cells were treated with vehicle (VEH, DMSO) or with OSU-03012 (OSU, 1 μM, 3 μM). Cells were isolated by trypsinization 48 h after drug treatments. Cell viability was determined using a trypan blue exclusion assay in triplicate. Data are from a representative experiment (n = 3). (*, p < 0.05 less than corresponding siSCR value). Inset, cells were isolated 24 h after vehicle or OSU-03012 treatment and subjected to SDS-PAGE followed by immunoblotting for AIF performed. B, U251 cells were stably transfected with either a scrambled siRNA (siSCR) or an siRNA against AIF (siAIF) (see inset immunoblotting panel). Cells, 24h after plating, were treated with vehicle (VEH, DMSO) or with OSU-03012 (OSU, 1 μM, 2 μM, 5 μM). Cells were isolated by trypsinization 48h after drug treatments. Cell viability was determined using a trypan blue exclusion assay in triplicate. Data are from a representative experiment (n = 3). (*, p < 0.05 less than corresponding siSCR value). Similar data were observed in multiple individual clones of these transfected U251 cells (data not shown). C, MEFs were treated with vehicle (DMSO) or with OSU-03012 (1-3 μM). Cells were isolated by trypsinization 48 h after drug treatment. Cell viability was determined using a trypan blue exclusion assay in triplicate. Data are from a representative experiment (n = 3). (*, p < 0.05 less than corresponding value in wild-type fibroblasts). D, left, immortal MEFs, either WT or cathepsin B-/-, were cultured as described under Materials and Methods. Twenty-four hours after plating cells were treated with vehicle (VEH, DMSO) or with OSU-03012 (OSU, 1 μM). Cells were isolated by trypsinization at the indicated times after drug treatments and immunoblotting was performed to determine the cleavage status of BID in each cell line. A representative study is shown (n = 3). Right, MEFs, either WT, BID-/-, or cathepsin B-/- (Cath. B-/-), were cultured as described under Materials and Methods. Twenty-four hours after plating cells were treated with vehicle (VEH, DMSO) or with OSU-03012 (OSU, 1 μM). Cells were isolated by trypsinization 6 h after OSU-03012 treatment, and the cytosolic fraction was isolated as described under Materials and Methods. Immunoblotting was performed to determine the release of AIF into the cytosol after OSU-03012 treatment. A representative study is shown (n = 3).
Fig. 2
Fig. 2
OSU-03012 toxicity is reduced in PERK-/- fibroblasts and in cells lacking caspase 4 function. A, transformed WT and PERK-/- MEFs were cultured as described under Materials and Methods. Twenty-four hours after plating, cells were treated with vehicle (VEH, DMSO) or with OSU-03012 (OSU, 0-2 μM). Top left, 6 hours after OSU-03012 exposure (1 μM), cells were isolated and the total cell lysate was immunoblotted to determine the expression and cleavage status of cathepsin B. Top right, 6 hours after OSU-03012 exposure (1 μM), cells were isolated and hours after OSU-03012 exposure, cells were isolated and cytosolic fraction obtained. The release of AIF into the cytosol after OSU-03012 exposure was determined by immunoblotting. Bottom, transformed WT and PERK-/- MEFs were isolated by trypsinization 24 h after drug treatment. Cell viability was determined using a trypan blue exclusion assay in triplicate. Data are from a representative experiment (n = 3). (*, p < 0.05 less than value in WT cells). B, i, transformed WT and PERK-/- MEFs were cultured as described under Materials and Methods. Twenty-four hours after plating, cells were treated with vehicle (VEH, DMSO) or with OSU-03012 (OSU, 1 μM). Six and 12 h after drug treatment, cells were isolated and the total cell lysate was immunoblotted to determine the expression of pro-caspase 2 and procaspase 4. Data are from a representative experiment (n = 3). ii, left, U251 cells were cultured as described under Materials and Methods. Twenty-four hours after plating, cells were treated with vehicle (DMSO) or the cathepsin B inhibitor (cath. B inhib., 1 μM); 30 min later, they were treated with vehicle (VEH, DMSO) or with OSU-03012 (OSU, 1 μM). Cells were isolated by trypsinization 12 h after drug treatment, and immunoblotting was performed to determine the expression of pro-caspase 4. ii, right, U251 cells were transiently transfected as described under Materials and Methods 24 h after plating with either a scrambled siRNA (siSCR) or an siRNA against caspase 4 (sicaspase4). Forty-eight hours after transfection, cells were treated, where indicated, with the cathepsin B inhibitor (cath. B inhib.); 30 min later, cells were treated with vehicle (VEH, DMSO) or with OSU-03012 (OSU, 1 μM). Cells were isolated by trypsinization 12 h after drug treatments, and the total cell lysate was immuno-blotted to determine the expression of cathepsin B and pro-caspase 4. Data are from a representative experiment (n = 3). C, U251 cells were transiently transfected as described under Materials and Methods 24 h after plating with either a scrambled siRNA (siSCR) or an siRNA against caspase 4 (si-caspase4). Forty-eight hours after transfection, cells were treated, where indicated, with vehicle (VEH, DMSO) or with OSU-03012 (OSU, 1 μM). Cells were isolated by trypsinization 48 h after drug treatments and cell viability was determined using a trypan blue exclusion assay in triplicate. Data are from a representative experiment (n = 3). (*, p < 0.05 less than corresponding value in siSCR-transfected cells).
Fig. 3
Fig. 3
OSU-03012 causes vacuolization of low pH vesicles and LC3 containing vesicles in transformed cells. A, transformed WT MEF, WT, and PERK-/- were plated in four-chamber glass slides and 24 h later treated with vehicle (DMSO) or with OSU-03012 (1 μM). Cells were fixed 6 h after drug exposure and stained with Lysotracker Red dye. Cells were visualized at 40× using an Axiovert 200 fluorescent microscope under fluorescent light and visible light. Data shown is a representative field from one experiment (n = 3). White arrows denote areas of intense staining, indicative of vacuolization. B, U251 cells were plated in four-chamber glass slides and 24 h later treated with vehicle (DMSO) or with OSU-03012 (1 μM). Cells were fixed 6 h after drug exposure and stained with Lysotracker Red dye. Cells were visualized at 40× using an Axiovert 200 fluorescent microscope under fluorescent light and visible light. Data shown is a representative field from one experiment (n = 3). White arrows denote areas of intense staining, indicative of vacuolization. C, U251, GBM6, and GBM12 cells were plated in four-chamber glass slides and 24 h later transfected with an empty vector plasmid or a plasmid to express a GFP-tagged form of LC3. Twenty-four hours after transfection, cells were treated with vehicle (DMSO) or with OSU-03012 (1 μM). Three and 6 h after OSU-03012 treatment, as indicated, cells were stained, where indicated, with Lysotracker Red dye and the cells were visualized at 40X using an Axiovert 200 fluorescent microscope under fluorescent light (Lysotracker Red dye-stained cells were visualized immediately after staining on a Zeiss Axiovert 200 microscope using the rhodamine filter). LC3-GFP transfected cells were visualized at the indicated 3- and 6-h time points on the Zeiss Axiovert 200 microscope using the FITC filter and under visible light. Data shown is a representative field from one experiment (n = 3). D, U251 cells were plated in four-chamber glass slides and 24 h later treated transfected with an empty vector plasmid or a plasmid to express a GFP-tagged form of LC3. In parallel, the cells were transfected with an empty vector plasmid or a plasmid to express a truncated dominant-negative form of PERK. Twenty-four hours after transfection, cells were pretreated with vehicle (veh, phosphate-buffered saline) or 3-methyl adenine (5 mM) followed 30 min later by vehicle (VEH, DMSO) or with OSU-03012 (OSU, 1 μM). Six hours after OSU-03012 treatment, cells were visualized at 40× using an Axiovert 200 fluorescent microscope under fluorescent light on the Zeiss Axiovert 200 microscope using the FITC filter and under visible light. Data shown is a representative field from one experiment (n = 3). E, transformed WT mouse embryonic fibroblasts, WT, or PERK-/-, were plated and 24 h later treated with vehicle (DMSO) or with OSU-03012 (1 μM). Cells were isolated 6 h after drug exposure, and the total cell lysate was immunoblotted to determine the expression of Beclin 1, ATG5, and LC3. Data shown are representative of one experiment (n = 3). F, U251 cells were plated in four-chamber glass slides and 24 h later transfected with an empty vector plasmid or a plasmid to express a GFP-tagged form of LC3. In parallel, the cells were transfected with an empty vector plasmid expressing a scrambled siRNA sequence (siSCR) or with plasmids to express siRNAs to suppress the expression of Beclin 1 (siBeclin 1) or to suppress expression of ATG5 (siATG5). Forty-eight hours after transfection, cells were treated with vehicle (VEH, DMSO) or with OSU-03012 (OSU, 1 μM). Six hours after OSU-03012 treatment, cells were visualized at 40× using an Axiovert 200 fluorescent microscope under fluorescent light on the Zeiss Axiovert 200 microscope using the FITC filter and under visible light. Data shown is a representative field from one experiment (n = 3). In parallel studies, inset to right, cells were isolated 6 h after drug exposure, and total cell lysates were immunoblotted to determine the expression of Beclin 1, ATG5, and LC3 after OSU-03012 treatment and in cells transfected with the siBeclin 1 and with the siATG5 constructs. Data shown is a representative field from one experiment (n = 3). G, U251 cells were plated in four-chamber glass slides and 24 h later transfected with an empty vector plasmid expressing a scrambled siRNA sequence (siSCR) or with plasmids to express siRNAs to suppress the expression of Beclin 1 (siBeclin 1) or to suppress expression of ATG5 (siATG5). Forty-eight hours after transfection, cells were treated with vehicle (VEH, DMSO) or with OSU-03012 (OSU, 1 μM). Cells were isolated by trypsinization 48 h after drug treatments, and cell viability was determined using a trypan blue exclusion assay in triplicate. Data are from a representative experiment (n = 3). (*, p < 0.05 less than corresponding value in siSCR-transfected cells).
Fig. 3
Fig. 3
OSU-03012 causes vacuolization of low pH vesicles and LC3 containing vesicles in transformed cells. A, transformed WT MEF, WT, and PERK-/- were plated in four-chamber glass slides and 24 h later treated with vehicle (DMSO) or with OSU-03012 (1 μM). Cells were fixed 6 h after drug exposure and stained with Lysotracker Red dye. Cells were visualized at 40× using an Axiovert 200 fluorescent microscope under fluorescent light and visible light. Data shown is a representative field from one experiment (n = 3). White arrows denote areas of intense staining, indicative of vacuolization. B, U251 cells were plated in four-chamber glass slides and 24 h later treated with vehicle (DMSO) or with OSU-03012 (1 μM). Cells were fixed 6 h after drug exposure and stained with Lysotracker Red dye. Cells were visualized at 40× using an Axiovert 200 fluorescent microscope under fluorescent light and visible light. Data shown is a representative field from one experiment (n = 3). White arrows denote areas of intense staining, indicative of vacuolization. C, U251, GBM6, and GBM12 cells were plated in four-chamber glass slides and 24 h later transfected with an empty vector plasmid or a plasmid to express a GFP-tagged form of LC3. Twenty-four hours after transfection, cells were treated with vehicle (DMSO) or with OSU-03012 (1 μM). Three and 6 h after OSU-03012 treatment, as indicated, cells were stained, where indicated, with Lysotracker Red dye and the cells were visualized at 40X using an Axiovert 200 fluorescent microscope under fluorescent light (Lysotracker Red dye-stained cells were visualized immediately after staining on a Zeiss Axiovert 200 microscope using the rhodamine filter). LC3-GFP transfected cells were visualized at the indicated 3- and 6-h time points on the Zeiss Axiovert 200 microscope using the FITC filter and under visible light. Data shown is a representative field from one experiment (n = 3). D, U251 cells were plated in four-chamber glass slides and 24 h later treated transfected with an empty vector plasmid or a plasmid to express a GFP-tagged form of LC3. In parallel, the cells were transfected with an empty vector plasmid or a plasmid to express a truncated dominant-negative form of PERK. Twenty-four hours after transfection, cells were pretreated with vehicle (veh, phosphate-buffered saline) or 3-methyl adenine (5 mM) followed 30 min later by vehicle (VEH, DMSO) or with OSU-03012 (OSU, 1 μM). Six hours after OSU-03012 treatment, cells were visualized at 40× using an Axiovert 200 fluorescent microscope under fluorescent light on the Zeiss Axiovert 200 microscope using the FITC filter and under visible light. Data shown is a representative field from one experiment (n = 3). E, transformed WT mouse embryonic fibroblasts, WT, or PERK-/-, were plated and 24 h later treated with vehicle (DMSO) or with OSU-03012 (1 μM). Cells were isolated 6 h after drug exposure, and the total cell lysate was immunoblotted to determine the expression of Beclin 1, ATG5, and LC3. Data shown are representative of one experiment (n = 3). F, U251 cells were plated in four-chamber glass slides and 24 h later transfected with an empty vector plasmid or a plasmid to express a GFP-tagged form of LC3. In parallel, the cells were transfected with an empty vector plasmid expressing a scrambled siRNA sequence (siSCR) or with plasmids to express siRNAs to suppress the expression of Beclin 1 (siBeclin 1) or to suppress expression of ATG5 (siATG5). Forty-eight hours after transfection, cells were treated with vehicle (VEH, DMSO) or with OSU-03012 (OSU, 1 μM). Six hours after OSU-03012 treatment, cells were visualized at 40× using an Axiovert 200 fluorescent microscope under fluorescent light on the Zeiss Axiovert 200 microscope using the FITC filter and under visible light. Data shown is a representative field from one experiment (n = 3). In parallel studies, inset to right, cells were isolated 6 h after drug exposure, and total cell lysates were immunoblotted to determine the expression of Beclin 1, ATG5, and LC3 after OSU-03012 treatment and in cells transfected with the siBeclin 1 and with the siATG5 constructs. Data shown is a representative field from one experiment (n = 3). G, U251 cells were plated in four-chamber glass slides and 24 h later transfected with an empty vector plasmid expressing a scrambled siRNA sequence (siSCR) or with plasmids to express siRNAs to suppress the expression of Beclin 1 (siBeclin 1) or to suppress expression of ATG5 (siATG5). Forty-eight hours after transfection, cells were treated with vehicle (VEH, DMSO) or with OSU-03012 (OSU, 1 μM). Cells were isolated by trypsinization 48 h after drug treatments, and cell viability was determined using a trypan blue exclusion assay in triplicate. Data are from a representative experiment (n = 3). (*, p < 0.05 less than corresponding value in siSCR-transfected cells).
Fig. 4
Fig. 4
Loss of cathepsin B expression abolishes OSU-03012-induced acidic endosome formation but not GFP-LC3 vacuolization. Immortal MEFs, either WT or cathepsin B-/-, were cultured as described under Materials and Methods. Twenty-four hours after plating, cells were transfected with an empty vector plasmid or a plasmid to express a GFP-tagged form of LC3. Twenty-four hours after transfection, cells were treated with vehicle (DMSO) or with OSU-03012 (1 μM). Six hours after OSU-03012 treatment, cells were stained where indicated with Lysotracker Red, and the cells were visualized at 40× using an Axiovert 200 fluorescent microscope under fluorescent light (Lysotracker Red dye-stained cells were visualized immediately after staining on a Zeiss Axiovert 200 microscope using the rhodamine filter. LC3-GFP transfected cells were visualized at the indicated time points on the Zeiss Axiovert 200 microscope using the FITC filter and under visual light. Data shown is a representative field from one experiment (n = 3). White arrows denote areas of intense staining, indicative of vacuolization.
Fig. 5
Fig. 5
OSU-03012 enhances HSP70 expression and suppresses Grp78/BiP levels in a PERK-dependent fashion. A, i, SV40-transformed WT and PERK-/- MEFs were cultured as described under Materials and Methods. Twenty-four hours after plating, cells were treated with DMSO vehicle or with OSU-03012 (OSU, 1 μM). Cells were isolated at the indicated time points and lysed. Cell lysates were subjected to SDS-PAGE and immunoblotting to determine the expression of HSP70, HSP90, BiP/Grp78, Grp94, CHOP/GADD153, and ERK2 (n = 5-7). ii, SV40-transformed WT were cultured as described under Materials and Methods on coated glass chamber slides. Twenty-four hours after plating, cells were treated with DMSO vehicle or with OSU-03012 (OSU, 1 μM). Cells were fixed 6 h after OSU-03012 treatment and stained with an anti-HSP70 antibody followed by a secondary antibody linked to FITC. Cells were visualized under fluorescent and visible light. A representative field is shown (n = 2 independent studies). B, the relative expression of HSP70 and HSP90 in OSU-03012-treated WT and PERK-/- MEFs from the time course analyses in A was calculated from the digital images in A and presented graphically (± S.E.M., n = 5-7). C, WT MEFs and U251 cells were plated and 12 h later transfected with a plasmid containing the full-length human HSP70 promoter coupled to the production of luciferase. Twenty-four hours after transfection, cells were treated with OSU-03012 (1 μM). The activity of the promoter was determined by luciferase activity in portions of cell lysate isolated at the indicated times. Data are a representative study in sextuplicate from three separate experiments (± S.E.M.). D, twenty-four hours after plating, U251 cells and fibroblasts were treated with vehicle (VEH, DMSO) or with the HSP70 inhibitor NZ28 (1 μM) as indicated, followed 30 min later by vehicle (VEH, DMSO) or OSU-03012 (1-3 μM) as indicated. Cells were isolated 48 h after drug treatment by trypsinization. Cell viability was determined using a trypan blue exclusion assay in triplicate, and a representative experiment ± S.E.M. is shown from multiple experiments (n = 3). E, U251 cells were stably transfected with either a scrambled siRNA (siSCR) or an siRNA to knockdown expression of AIF (siAIF) (see also Fig. 1). Twenty-four hours after plating, cells were treated with vehicle (VEH, DMSO) or with NZ28 (1 μM) followed 30 min later by vehicle (VEH, DMSO) or OSU-03012 (OSU, 1 μM, 2 μM, 5 μM). Cells were isolated by trypsinization 48 h after drug treatments. Cell viability was determined using a trypan blue exclusion assay in triplicate ± S.E.M. Data are from a representative experiment (n = 3).
Fig. 5
Fig. 5
OSU-03012 enhances HSP70 expression and suppresses Grp78/BiP levels in a PERK-dependent fashion. A, i, SV40-transformed WT and PERK-/- MEFs were cultured as described under Materials and Methods. Twenty-four hours after plating, cells were treated with DMSO vehicle or with OSU-03012 (OSU, 1 μM). Cells were isolated at the indicated time points and lysed. Cell lysates were subjected to SDS-PAGE and immunoblotting to determine the expression of HSP70, HSP90, BiP/Grp78, Grp94, CHOP/GADD153, and ERK2 (n = 5-7). ii, SV40-transformed WT were cultured as described under Materials and Methods on coated glass chamber slides. Twenty-four hours after plating, cells were treated with DMSO vehicle or with OSU-03012 (OSU, 1 μM). Cells were fixed 6 h after OSU-03012 treatment and stained with an anti-HSP70 antibody followed by a secondary antibody linked to FITC. Cells were visualized under fluorescent and visible light. A representative field is shown (n = 2 independent studies). B, the relative expression of HSP70 and HSP90 in OSU-03012-treated WT and PERK-/- MEFs from the time course analyses in A was calculated from the digital images in A and presented graphically (± S.E.M., n = 5-7). C, WT MEFs and U251 cells were plated and 12 h later transfected with a plasmid containing the full-length human HSP70 promoter coupled to the production of luciferase. Twenty-four hours after transfection, cells were treated with OSU-03012 (1 μM). The activity of the promoter was determined by luciferase activity in portions of cell lysate isolated at the indicated times. Data are a representative study in sextuplicate from three separate experiments (± S.E.M.). D, twenty-four hours after plating, U251 cells and fibroblasts were treated with vehicle (VEH, DMSO) or with the HSP70 inhibitor NZ28 (1 μM) as indicated, followed 30 min later by vehicle (VEH, DMSO) or OSU-03012 (1-3 μM) as indicated. Cells were isolated 48 h after drug treatment by trypsinization. Cell viability was determined using a trypan blue exclusion assay in triplicate, and a representative experiment ± S.E.M. is shown from multiple experiments (n = 3). E, U251 cells were stably transfected with either a scrambled siRNA (siSCR) or an siRNA to knockdown expression of AIF (siAIF) (see also Fig. 1). Twenty-four hours after plating, cells were treated with vehicle (VEH, DMSO) or with NZ28 (1 μM) followed 30 min later by vehicle (VEH, DMSO) or OSU-03012 (OSU, 1 μM, 2 μM, 5 μM). Cells were isolated by trypsinization 48 h after drug treatments. Cell viability was determined using a trypan blue exclusion assay in triplicate ± S.E.M. Data are from a representative experiment (n = 3).
Fig. 6
Fig. 6
Modulation of HSP70 expression changes OSU-03012 lethality. A, HCT116 cells were cultured as described under Materials and Methods and, 12 h after plating, transfected with either a scrambled siRNA (siSCR) or an siRNA to suppress expression of HSP70 (siHSP70). Twenty-four hours after transfection, cells were treated with vehicle (VEH, DMSO) or with OSU-03012 (OSU, 0-3 μM). Cells were isolated by trypsinization 24 h after drug treatments. Cell viability was determined using a trypan blue exclusion assay in triplicate. Data are from a representative experiment (n = 3). (#, p < 0.05 greater than corresponding value in the siSCR cells). Inset, blots, bottom, HCT116 cells were lysed before OSU-03012 addition and the expression of HSP70 determined by immunoblotting. Top, HCT116 cells were treated with OSU-03012 (1 mM), cells isolated at the indicated time points, and the expression of HSP70, BiP/Grp78, and ERK2 determined by immunoblotting. B, U251 cells were cultured as described under Materials and Methods and 12 h after plating transfected with either a scrambled siRNA (siSCR) or an siRNA to suppress expression of HSP70 (siHSP70). Twenty-four hours after transfection, cells were treated with vehicle (VEH, DMSO) or with OSU-03012 (OSU, 0-3 μM). Cells were isolated by trypsinization 24 h after drug treatments. Cell viability was determined using a trypan blue exclusion assay in triplicate. Data are from a representative experiment (n = 3). (#, p < 0.05 greater than corresponding value in the siSCR cells). Inset, blotting, bottom, U251 cells were lysed before OSU-03012 addition and the expression of HSP70 determined by immunoblotting. Top, U251 cells were treated with OSU-03012 (1 mM), cells isolated at the indicated time points, and the expression of HSP70, BiP/Grp78, and ERK2 determined by immunoblotting. C, HCT116 cells were cultured as described under Materials and Methods and, 12 h after plating, were infected with either an empty vector control recombinant adenovirus (CMV) or an adenovirus to express HSP70. Twenty-four hours after infection, cells were treated with vehicle (VEH, DMSO) or with OSU-03012 (OSU, 2 μM, 3 μM). Cells were isolated by trypsinization 24 h after drug treatments. Cell viability was determined using a trypan blue exclusion assay in triplicate. Data are from a representative experiment (n = 3). *, p < 0.05 less than corresponding value in the CMV-infected cells. Inset, microscopy, U251 and HCT116 cells were plated in four-chamber glass slides and, 12 h after plating, were infected with either a control recombinant adenovirus (CMV) or a recombinant adenovirus to express HSP70. Twenty-four hours after infection, cells were treated with vehicle (DMSO) or with OSU-03012 (1 μM). Cells were fixed 6 h after drug exposure and stained with Lysotracker Red (Lt) dye. Cells were visualized at 40× using an Axiovert 200 fluorescent microscope under fluorescent light and visual light. Data shown is a representative field from one experiment (n = 3). White arrows denote areas of intense staining, indicative of vacuolization. Inset, blot, HCT116 cells were cultured as described under Materials and Methods. Twenty-four hours after infection, cells were treated with DMSO vehicle or with OSU-03012 (OSU, 1 μM). Cells were isolated at the indicated time points and lysed. Cells lysates were subjected to SDS PAGE and immunoblotting to determine the expression of HSP70, BiP/Grp78, and ERK2 (n = 3). D, U251 cells were cultured as described under Materials and Methods, and 12 h after plating infected with either an empty vector control recombinant adenovirus (CMV) or an adenovirus to express HSP70. Twenty-four hours after infection, cells were treated with vehicle (VEH, DMSO) or with OSU-03012 (OSU, 1 μM, 2 μM). Cells were isolated by trypsinization 24 h after drug treatments. Cell viability was determined using a trypan blue exclusion assay in triplicate. Data are from a representative experiment (n = 3). (*, p < 0.05 less than corresponding value in the CMV infected cells). Inset, microscopy, U251 cells were plated in four-chamber glass slides and, 12 h after plating, infected with either a control recombinant adenovirus (CMV) or a recombinant adenovirus to express HSP70. Twenty-four hours after infection, cells were transfected with a plasmid to express GFP-LC3. Twenty-four hours after transfection, cells were treated with vehicle (VEH, DMSO) or with OSU-03012 (1 μM). The appearance of punctate GFP-LC3 vacuoles was examined 6 h after drug exposure (n = 2). Inset, blotting, U251 cells were cultured as described under Materials and Methods. Twenty-four hours after infection, cells were lysed and were subjected to SDS-PAGE and immunoblotting to determine the expression of HSP70 and ERK2 (n = 3).
Fig. 7
Fig. 7
Modulation of HSP70 expression changes OSU-03012 lethality. A, SV40-transformed WT and PERK-/- MEFs were cultured as described under Materials and Methods. Cells, 24 h after plating were treated with DMSO vehicle or with OSU-03012 (OSU, 1 μM) and or 17AAG (100 nM; 300 nM). Cells were isolated 24 h after drug exposure and cell viability was determined using a trypan blue exclusion assay in triplicate. Data are from a representative experiment (n = 3) (#, p < 0.05 greater than cells lacking OSU-03012 treatment; $, p < 0.05 less than corresponding value in WT MEF cell. Inset, blotting, cells were lysed 12 h after OSU-03012 addition and the expression of ERK2, HSP70, and HSP90 determined by immunoblotting. B, U251 cells were cultured as described under Materials and Methods and 12 h after plating transfected with either an empty vector control plasmid (CMV) or a plasmid to express dominant negative PERK (dnPERK). Twenty-four hours after transfection, cells were treated with vehicle (VEH, DMSO) or with OSU-03012 (OSU, 0.5-1 μM) and/or 17AAG (100 nM, 300 nM). Cells were isolated by trypsinization 24 h after drug treatments. Cell viability was determined using a trypan blue exclusion assay in triplicate. Data are from a representative experiment (n = 3). (#, p < 0.05 greater than corresponding value in the CMV cells). Inset, blotting, U251 cells were lysed6hand 24 h after OSU-03012 (1 μM) and/or 17AAG (100 nM) addition and the expression of HSP70 and GAPDH determined by immunoblotting.

Similar articles

Cited by

References

    1. Carón RW, Yacoub A, Li M, Zhu X, Mitchell C, Hong Y, Hawkins W, Sasazuki T, Shirasawa S, Kozikowski AP, Dennis PA, Hagan MP, Grant S, Dent P. Activated forms of H-RAS and K-RAS differentially regulate membrane association of PI3K, PDK-1, and AKT and the effect of therapeutic kinase inhibitors on cell survival. Mol Cancer Ther. 2005;4:257–270. - PubMed
    1. Cui W, Yu CH, Hu KQ. In vitro and in vivo effects and mechanisms of celecoxib-induced growth inhibition of human hepatocellular carcinoma cells. Clin Cancer Res. 2005;11:8213–8221. - PubMed
    1. Demidenko ZN, Vivo C, Halicka HD, Li CJ, Bhalla K, Broude EV, Blagoskonny MV. Pharmacological induction of Hsp70 protects apoptosis-prone cells from doxorubicin: comparison with caspase inhibitor- and cycle-arrest-mediated cyto-protection. Cell Death Differ. 2006;13:1434–1441. - PubMed
    1. Dent P, Yacoub A, Fisher PB, Hagan MP, Grant S. MAPK pathways in radiation responses. Oncogene. 2003;22:5885–5896. - PubMed
    1. Dunn WA. Autophagy and related mechanisms of lysosome-mediated protein degradation. Trends Cell Biol. 1994;4:139–143. - PubMed

Publication types

MeSH terms