Anomalous dynamics of cell migration
- PMID: 18182493
- PMCID: PMC2206558
- DOI: 10.1073/pnas.0707603105
Anomalous dynamics of cell migration
Abstract
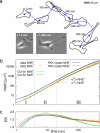
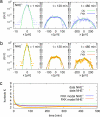
Cell movement--for example, during embryogenesis or tumor metastasis--is a complex dynamical process resulting from an intricate interplay of multiple components of the cellular migration machinery. At first sight, the paths of migrating cells resemble those of thermally driven Brownian particles. However, cell migration is an active biological process putting a characterization in terms of normal Brownian motion into question. By analyzing the trajectories of wild-type and mutated epithelial (transformed Madin-Darby canine kidney) cells, we show experimentally that anomalous dynamics characterizes cell migration. A superdiffusive increase of the mean squared displacement, non-Gaussian spatial probability distributions, and power-law decays of the velocity autocorrelations is the basis for this interpretation. Almost all results can be explained with a fractional Klein-Kramers equation allowing the quantitative classification of cell migration by a few parameters. Thereby, it discloses the influence and relative importance of individual components of the cellular migration apparatus to the behavior of the cell as a whole.
Conflict of interest statement
The authors declare no conflict of interest.
Figures


Similar articles
-
Non-Brownian dynamics and strategy of amoeboid cell locomotion.Phys Rev E Stat Nonlin Soft Matter Phys. 2012 Apr;85(4 Pt 1):041909. doi: 10.1103/PhysRevE.85.041909. Epub 2012 Apr 11. Phys Rev E Stat Nonlin Soft Matter Phys. 2012. PMID: 22680500
-
Anomalous diffusion and q-Weibull velocity distributions in epithelial cell migration.PLoS One. 2017 Jul 10;12(7):e0180777. doi: 10.1371/journal.pone.0180777. eCollection 2017. PLoS One. 2017. PMID: 28700652 Free PMC article.
-
Physics of active jamming during collective cellular motion in a monolayer.Proc Natl Acad Sci U S A. 2015 Dec 15;112(50):15314-9. doi: 10.1073/pnas.1510973112. Epub 2015 Dec 1. Proc Natl Acad Sci U S A. 2015. PMID: 26627719 Free PMC article.
-
Plasticity of renal epithelial cells: the way a potassium channel supports migration.Pflugers Arch. 1996;432(3 Suppl):R87-93. Pflugers Arch. 1996. PMID: 8994548 Review.
-
Phenomenological approaches to collective behavior in epithelial cell migration.Biochim Biophys Acta. 2015 Nov;1853(11 Pt B):3143-52. doi: 10.1016/j.bbamcr.2015.05.021. Epub 2015 May 29. Biochim Biophys Acta. 2015. PMID: 26028592 Review.
Cited by
-
Study of Wound Healing Dynamics by Single Pseudo-Particle Tracking in Phase Contrast Images Acquired in Time-Lapse.Entropy (Basel). 2021 Feb 26;23(3):284. doi: 10.3390/e23030284. Entropy (Basel). 2021. PMID: 33652826 Free PMC article.
-
Aggregation of adult parasitic nematodes in sex-mixed groups analysed by transient anomalous diffusion formalism.J R Soc Interface. 2024 Oct;21(219):20240327. doi: 10.1098/rsif.2024.0327. Epub 2024 Oct 9. J R Soc Interface. 2024. PMID: 39379003 Free PMC article.
-
Bézier interpolation improves the inference of dynamical models from data.Phys Rev E. 2023 Feb;107(2-1):024116. doi: 10.1103/PhysRevE.107.024116. Phys Rev E. 2023. PMID: 36932614 Free PMC article.
-
A three component model for superdiffusive motion effectively describes migration of eukaryotic cells moving freely or under a directional stimulus.PLoS One. 2022 Aug 2;17(8):e0272259. doi: 10.1371/journal.pone.0272259. eCollection 2022. PLoS One. 2022. PMID: 35917375 Free PMC article.
-
Time-lapse analysis of human embryonic stem cells reveals multiple bottlenecks restricting colony formation and their relief upon culture adaptation.Stem Cell Reports. 2014 Jun 12;3(1):142-55. doi: 10.1016/j.stemcr.2014.05.006. eCollection 2014 Jul 8. Stem Cell Reports. 2014. PMID: 25068128 Free PMC article.
References
Publication types
MeSH terms
LinkOut - more resources
Full Text Sources

