

Effects of adiponectin on breast cancer cell growth and signaling
- PMID: 18182989
- PMCID: PMC2361440
- DOI: 10.1038/sj.bjc.6604166
Effects of adiponectin on breast cancer cell growth and signaling
Abstract
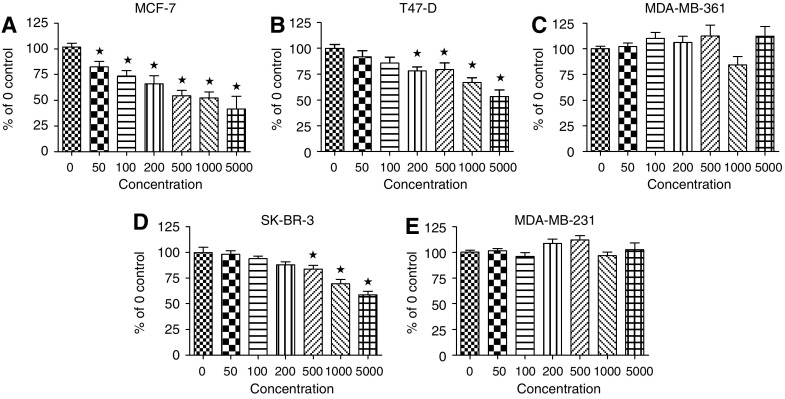
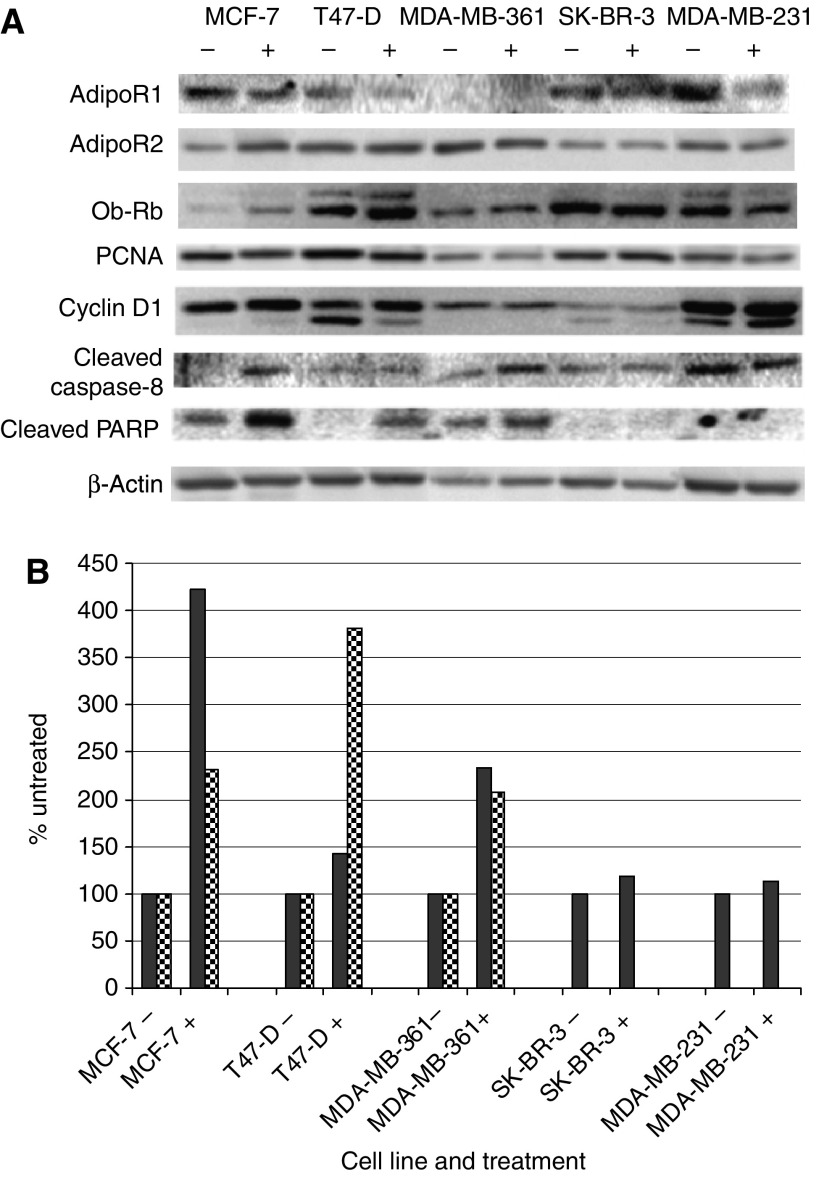
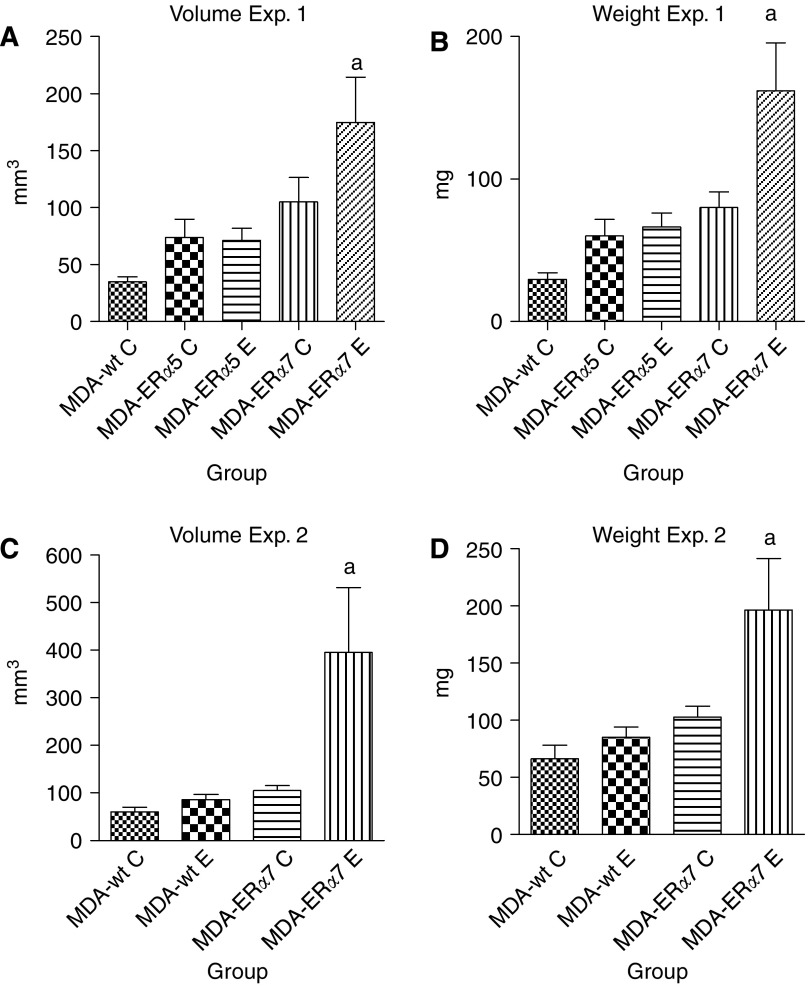
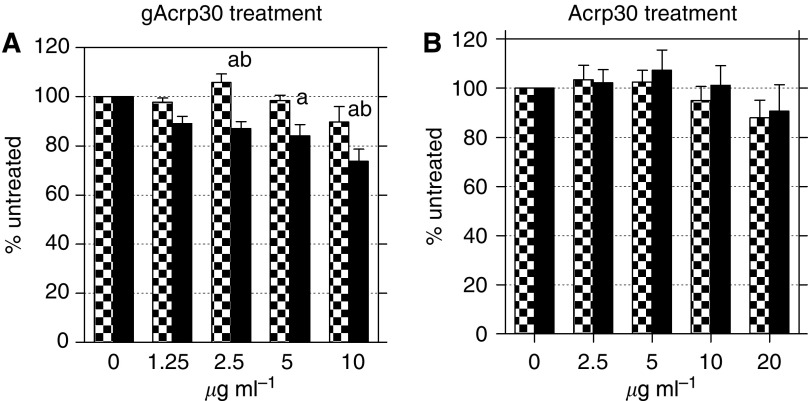
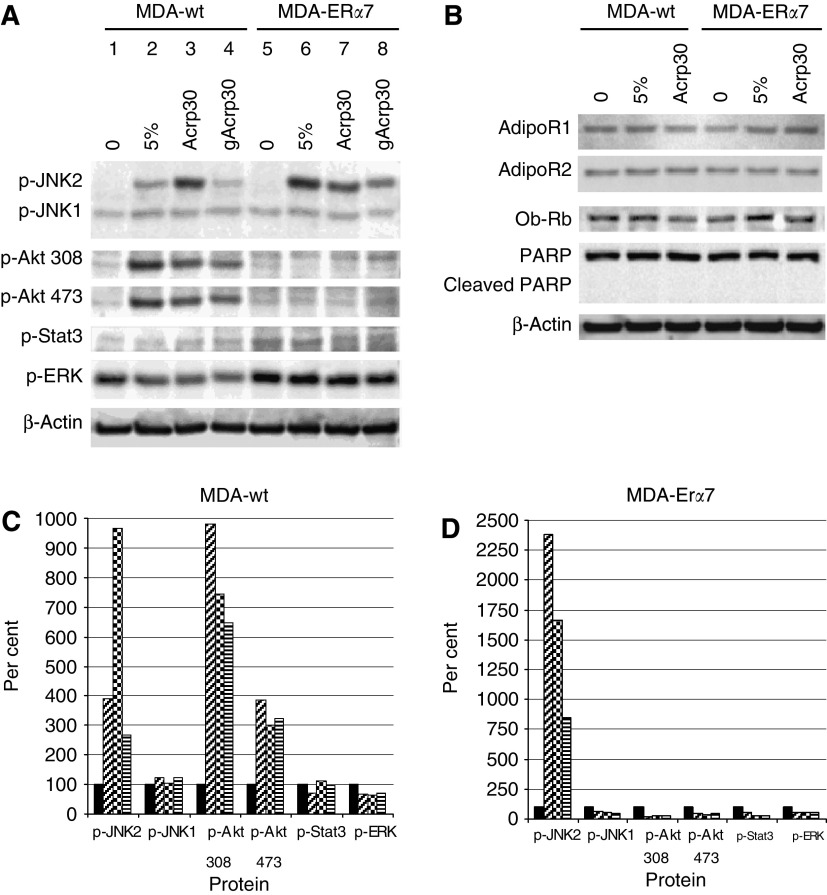
Obesity is a risk factor for postmenopausal breast cancer. Adiponectin/Acrp30 is lower in obese individuals and may be negatively regulating breast cancer growth. Here we determined that five breast cancer cell lines, MDA-MB-231, MDA-MB-361, MCF-7, T47D, and SK-BR-3, expressed one or both of the Acrp30 receptors. In addition, we found that the addition of Acrp30 to MCF-7, T47D, and SK-BR-3 cell lines inhibited growth. Oestrogen receptor (ER) positive MCF-7 and T47D cells were inhibited at lower Acrp30 concentrations than ER-negative SK-BR-3 cells. Growth inhibition may be related to apoptosis since PARP cleavage was increased by Acrp30 in the ER-positive cell lines. To investigate the role of ER in the response of breast cancer cells to Acrp30, we established the MDA-ERalpha7 cell line by insertion of ER-alpha into ER-alpha-negative MDA-MB-231 cells. This line readily formed tumours in athymic mice and was responsive to oestradiol in vivo. In vitro, MDA-ERalpha7 cells were growth inhibited by globular Acrp30 while the parental cells were not. This inhibition appeared to be due to blockage of JNK2 signalling. These results provide information on how obesity may influence breast cancer cell proliferation and establish a new model to examine interactions between ER and Acrp30.
Figures
Similar articles
-
Association of increased basement membrane invasiveness with absence of estrogen receptor and expression of vimentin in human breast cancer cell lines.J Cell Physiol. 1992 Mar;150(3):534-44. doi: 10.1002/jcp.1041500314. J Cell Physiol. 1992. PMID: 1537883
-
[Angiogenic effect of interleukin-8 in breast cancer and its association with estrogen receptor].Zhonghua Yi Xue Za Zhi. 2005 Jun 1;85(20):1419-23. Zhonghua Yi Xue Za Zhi. 2005. PMID: 16029657 Chinese.
-
P2Y2 receptor-mediated modulation of estrogen-induced proliferation of breast cancer cells.Mol Cell Endocrinol. 2011 May 16;338(1-2):28-37. doi: 10.1016/j.mce.2011.02.014. Epub 2011 Feb 26. Mol Cell Endocrinol. 2011. PMID: 21356271
-
Differential insulin-like growth factor I receptor signaling and function in estrogen receptor (ER)-positive MCF-7 and ER-negative MDA-MB-231 breast cancer cells.Cancer Res. 2001 Sep 15;61(18):6747-54. Cancer Res. 2001. PMID: 11559546
-
Adiponectin as a negative regulator in obesity-related mammary carcinogenesis.Cell Res. 2007 Apr;17(4):280-2. doi: 10.1038/cr.2007.14. Cell Res. 2007. PMID: 17404599 Review. No abstract available.
Cited by
-
Implications of obesity and insulin resistance for the treatment of oestrogen receptor-positive breast cancer.Br J Cancer. 2024 Dec;131(11):1724-1736. doi: 10.1038/s41416-024-02833-1. Epub 2024 Sep 9. Br J Cancer. 2024. PMID: 39251829 Free PMC article. Review.
-
Obesity and Androgen Receptor Signaling: Associations and Potential Crosstalk in Breast Cancer Cells.Cancers (Basel). 2021 May 6;13(9):2218. doi: 10.3390/cancers13092218. Cancers (Basel). 2021. PMID: 34066328 Free PMC article. Review.
-
The role of adiponectin in cancer: a review of current evidence.Endocr Rev. 2012 Aug;33(4):547-94. doi: 10.1210/er.2011-1015. Epub 2012 Apr 30. Endocr Rev. 2012. PMID: 22547160 Free PMC article. Review.
-
The pleiotropic roles of adipocyte secretome in remodeling breast cancer.J Exp Clin Cancer Res. 2022 Jun 14;41(1):203. doi: 10.1186/s13046-022-02408-z. J Exp Clin Cancer Res. 2022. PMID: 35701840 Free PMC article. Review.
-
Proliferative endocrine effects of adipose tissue from obese animals on MCF7 cells are ameliorated by resveratrol supplementation.PLoS One. 2017 Sep 5;12(9):e0183897. doi: 10.1371/journal.pone.0183897. eCollection 2017. PLoS One. 2017. PMID: 28873415 Free PMC article.
References
-
- Arditi JD, Venihaki M, Karalis KP, Chrousos GP (2007) Antiproliferative effect of adiponectin on MCF7 breast cancer cells: a potential hormonal link between obesity and cancer. Horm Metab Res 39: 9–13 - PubMed
-
- Arita Y, Kihara S, Ouchi N, Takahashi M, Maeda K, Miyagawa J, Hotta K, Shimomura I, Nakamura T, Miyaoka K, Kuriyama H, Nishida M, Yamashita S, Okubo K, Matsubara K, Muraguchi M, Ohmoto Y, Funahashi T, Matsuzawa Y (1999) Paradoxical decrease of an adipose-specific protein, adiponectin, in obesity. Biochem Biophys Res Commun 257: 79–83 - PubMed
-
- Bondanelli M, Margutti A, Ambrosio MR, Plaino L, Cobellis L, Petraglia F, degli Uberti EC (2001) Blood growth hormone-binding protein levels in premenopausal and postmenopausal women: roles of body weight and estrogen levels. J Clin Endocrinol Metab 86: 1973–1980 - PubMed
Publication types
MeSH terms
Substances
LinkOut - more resources
Full Text Sources
Other Literature Sources
Medical
Miscellaneous
