Broad and Gag-biased HIV-1 epitope repertoires are associated with lower viral loads
- PMID: 18183304
- PMCID: PMC2170517
- DOI: 10.1371/journal.pone.0001424
Broad and Gag-biased HIV-1 epitope repertoires are associated with lower viral loads
Abstract
Background: HLA class-I alleles differ in their ability to control HIV replication through cell-mediated immune responses. No consistent associations have been found between the breadth of Cytotoxic T Lymphocytes (CTL) responses and the control of HIV-1, and it is unknown whether the size or distribution of the viral proteome-wide epitope repertoire, i.e., the intrinsic ability to present fewer, more or specific viral epitopes, could affect clinical markers of disease progression.
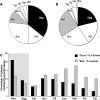
Methodology/principal findings: We used an epitope prediction model to identify all epitope motifs in a set of 302 HIV-1 full-length proteomes according to each individual's HLA (Human Leukocyte Antigen) genotype. The epitope repertoire, i.e., the number of predicted epitopes per HIV-1 proteome, varied considerably between HLA alleles and thus among individual proteomes. In a subgroup of 270 chronically infected individuals, we found that lower viral loads and higher CD4 counts were associated with a larger predicted epitope repertoire. Additionally, in Gag and Rev only, more epitopes were restricted by alleles associated with low viral loads than by alleles associated with higher viral loads.
Conclusions/significance: This comprehensive analysis puts forth the epitope repertoire as a mechanistic component of the multi-faceted HIV-specific CTL response. The favorable impact on markers of disease status of the propensity to present more HLA binding peptides and specific proteins gives impetus to vaccine design strategies that seek to elicit responses to a broad array of HIV-1 epitopes, and suggest a particular focus on Gag.
Conflict of interest statement
Figures


Similar articles
-
CTL response to HIV type 1 subtype C is poorly predicted by known epitope motifs.AIDS Res Hum Retroviruses. 2007 Aug;23(8):1033-41. doi: 10.1089/aid.2007.0024. AIDS Res Hum Retroviruses. 2007. PMID: 17725421
-
An HLA-C-restricted CD8+ cytotoxic T-lymphocyte clone recognizes a highly conserved epitope on human immunodeficiency virus type 1 gag.J Virol. 1991 Aug;65(8):4051-6. doi: 10.1128/JVI.65.8.4051-4056.1991. J Virol. 1991. PMID: 1712857 Free PMC article.
-
HLA supertypes contribute in HIV type 1 cytotoxic T lymphocyte epitope clustering in Nef and Gag proteins.AIDS Res Hum Retroviruses. 2013 Feb;29(2):270-8. doi: 10.1089/AID.2012.0160. Epub 2013 Jan 8. AIDS Res Hum Retroviruses. 2013. PMID: 23061377
-
Selective in vitro expansion of HLA class I-restricted HIV-1 Gag-specific CD8+ T cells: cytotoxic T-lymphocyte epitopes and precursor frequencies.AIDS. 1993 Jun;7(6):781-6. AIDS. 1993. PMID: 7689847
-
The HIV hide and seek game: an immunogenomic analysis of the HIV epitope repertoire.AIDS. 2009 Jul 17;23(11):1311-8. doi: 10.1097/QAD.0b013e32832c492a. AIDS. 2009. PMID: 19550286 Review.
Cited by
-
Gag and env conserved element CE DNA vaccines elicit broad cytotoxic T cell responses targeting subdominant epitopes of HIV and SIV Able to recognize virus-infected cells in macaques.Hum Vaccin Immunother. 2018;14(9):2163-2177. doi: 10.1080/21645515.2018.1489949. Epub 2018 Jul 12. Hum Vaccin Immunother. 2018. PMID: 29939820 Free PMC article.
-
For protection from HIV-1 infection, more might not be better: a systematic analysis of HIV Gag epitopes of two alleles associated with different outcomes of HIV-1 infection.J Virol. 2012 Jan;86(2):1166-80. doi: 10.1128/JVI.05721-11. Epub 2011 Nov 9. J Virol. 2012. PMID: 22072744 Free PMC article.
-
The impact of viral evolution and frequency of variant epitopes on primary and memory human immunodeficiency virus type 1-specific CD8⁺ T cell responses.Virology. 2014 Feb;450-451:34-48. doi: 10.1016/j.virol.2013.10.015. Epub 2013 Dec 20. Virology. 2014. PMID: 24503065 Free PMC article.
-
Relevance of studying T cell responses in SIV-infected rhesus macaques.Trends Microbiol. 2008 Dec;16(12):605-11. doi: 10.1016/j.tim.2008.08.010. Epub 2008 Oct 27. Trends Microbiol. 2008. PMID: 18964016 Free PMC article. Review.
-
HIV-1 gag cytotoxic T lymphocyte epitopes vary in presentation kinetics relative to HLA class I downregulation.J Virol. 2013 Aug;87(15):8726-34. doi: 10.1128/JVI.01040-13. Epub 2013 Jun 5. J Virol. 2013. PMID: 23740989 Free PMC article.
References
-
- Gea-Banacloche JC, Migueles SA, Martino L, Shupert WL, McNeil AC, et al. Maintenance of large numbers of virus-specific CD8+ T cells in HIV-infected progressors and long-term nonprogressors. J Immunol. 2000;165:1082–1092. - PubMed
Publication types
MeSH terms
Substances
Grants and funding
LinkOut - more resources
Full Text Sources
Other Literature Sources
Research Materials

