

Apoptosis of estrogen-receptor negative breast cancer and colon cancer cell lines by PTP alpha and src RNAi
- PMID: 18183590
- PMCID: PMC4878911
- DOI: 10.1002/ijc.23321
Apoptosis of estrogen-receptor negative breast cancer and colon cancer cell lines by PTP alpha and src RNAi
Abstract
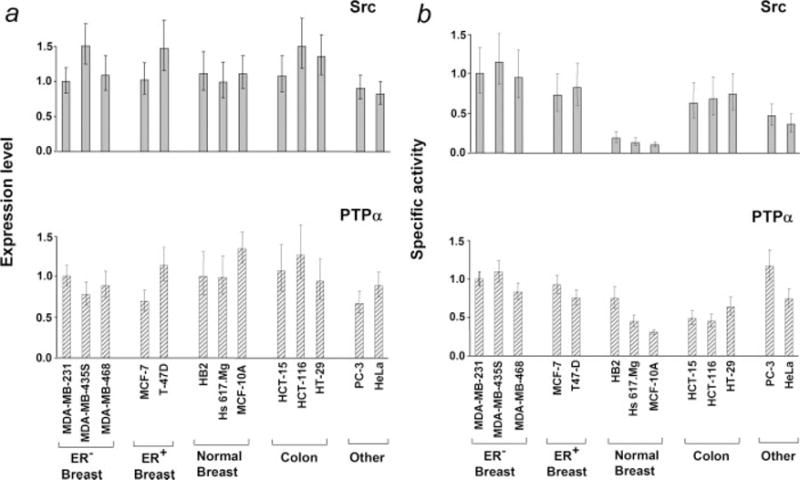
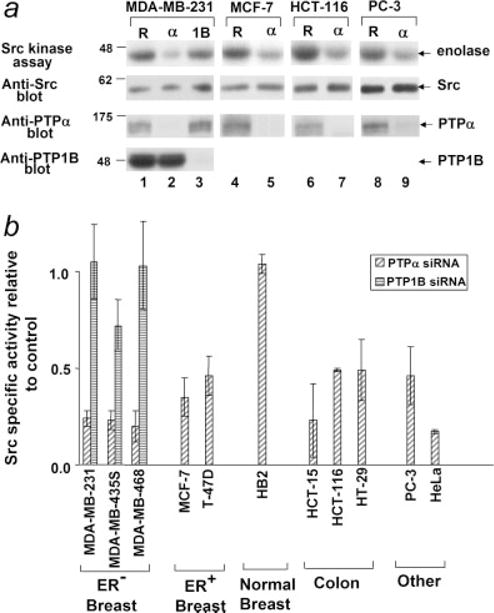
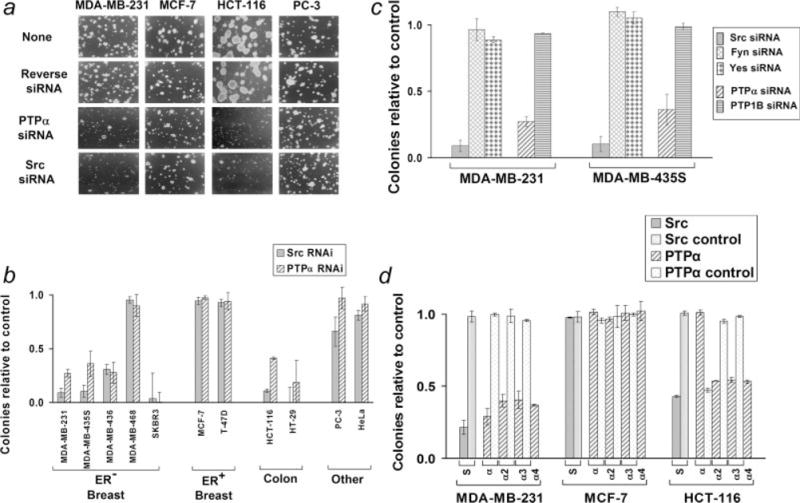
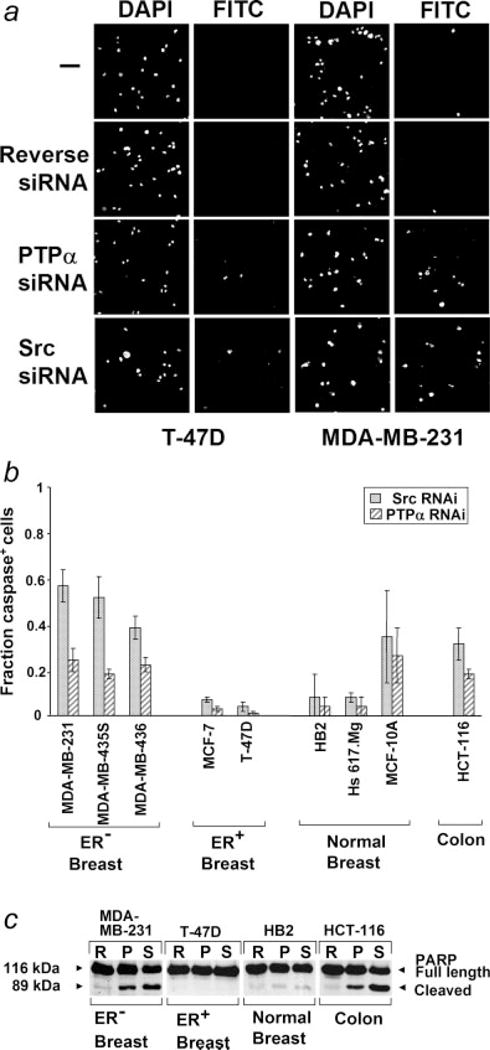
We show that siRNA-mediated suppression of protein tyrosine phosphatase alpha (PTP alpha) reduces Src activity 2 to 4-fold in breast, colon and other human cancer cell lines. Src and PTP alpha RNAi induced apoptosis in estrogen receptor (ER)-negative breast cancer and colon cancer cells, but not in immortalized noncancerous breast cells, ER-positive breast cancer cells or other cancer cell types tested. RNAi of other Src family members (Fyn and Yes) or of PTP1B, a phosphatase previously suggested to be an activator of Src in breast cancer, had no effect. Although further tests with primary tumor tissues are required, the unexpected correlation between ER status and Src/PTP alpha dependence in breast cancer cell lines may be important for planning therapeutic strategies, and the insensitivity of normal breast cells to the RNAi highlights the potential of PTP alpha, which may be easier to target than Src, as a therapeutic target in ER-negative breast cancer.
(c) 2008 Wiley-Liss, Inc.
Figures
Similar articles
-
17 beta-estradiol-regulated expression of protein tyrosine phosphatase gamma gene in cultured human normal breast and breast cancer cells.Anticancer Res. 2000 Jan-Feb;20(1A):11-9. Anticancer Res. 2000. PMID: 10769629
-
Src promotes estrogen-dependent estrogen receptor alpha proteolysis in human breast cancer.J Clin Invest. 2007 Aug;117(8):2205-15. doi: 10.1172/JCI21739. J Clin Invest. 2007. PMID: 17627304 Free PMC article.
-
Autocrine WNT signaling contributes to breast cancer cell proliferation via the canonical WNT pathway and EGFR transactivation.Breast Cancer Res. 2007;9(5):R63. doi: 10.1186/bcr1769. Breast Cancer Res. 2007. PMID: 17897439 Free PMC article.
-
SRC in human carcinogenesis.Front Biosci. 2004 Jan 1;9:139-44. doi: 10.2741/1138. Front Biosci. 2004. PMID: 14766353 Review.
-
c-Src, receptor tyrosine kinases, and human cancer.Adv Cancer Res. 1999;76:61-119. doi: 10.1016/s0065-230x(08)60774-5. Adv Cancer Res. 1999. PMID: 10218099 Review. No abstract available.
Cited by
-
Activation of Src and transformation by an RPTPα splice mutant found in human tumours.EMBO J. 2011 Jul 1;30(15):3200-11. doi: 10.1038/emboj.2011.212. EMBO J. 2011. PMID: 21725282 Free PMC article.
-
Substrate activity screening with kinases: discovery of small-molecule substrate-competitive c-Src inhibitors.Angew Chem Int Ed Engl. 2014 Jul 1;53(27):7010-3. doi: 10.1002/anie.201311096. Epub 2014 May 2. Angew Chem Int Ed Engl. 2014. PMID: 24797781 Free PMC article.
-
Oncogenic signaling by tyrosine kinases of the SRC family in advanced colorectal cancer.Am J Cancer Res. 2012;2(4):357-71. Epub 2012 Jun 28. Am J Cancer Res. 2012. PMID: 22860228 Free PMC article.
-
Receptor protein-tyrosine phosphatase α regulates focal adhesion kinase phosphorylation and ErbB2 oncoprotein-mediated mammary epithelial cell motility.J Biol Chem. 2013 Dec 27;288(52):36926-35. doi: 10.1074/jbc.M113.527564. Epub 2013 Nov 11. J Biol Chem. 2013. PMID: 24217252 Free PMC article.
-
Receptor Protein Tyrosine Phosphatase α-Mediated Enhancement of Rheumatoid Synovial Fibroblast Signaling and Promotion of Arthritis in Mice.Arthritis Rheumatol. 2016 Feb;68(2):359-69. doi: 10.1002/art.39442. Arthritis Rheumatol. 2016. PMID: 26414708 Free PMC article.
References
-
- Irby RB, Yeatman TJ. Role of Src expression and activation in human cancer. Oncogene. 2000;19:5636–42. - PubMed
-
- Ishizawar R, Parsons SJ. c-Src and cooperating partners in human cancer. Cancer Cell. 2004;6:209–14. - PubMed
-
- Verbeek BS, Vroom TM, Adriaansen-Slot SS, Ottenhoff-Kalff AE, Geertzema JG, Hennipman A, Rijksen G. c-Src protein expression is increased in human breast cancer. An immunohistochemical and biochemical analysis. J Pathol. 1996;180:383–8. - PubMed
-
- Belsches-Jablonski AP, Biscardi JS, Peavy DR, Tice DA, Romney DA, Parsons SJ. Src family kinases and HER2 interactions in human breast cancer cell growth and survival. Oncogene. 2001;20:1465–75. - PubMed
Publication types
MeSH terms
Substances
Grants and funding
LinkOut - more resources
Full Text Sources
Medical
Miscellaneous
