

Failure of TLR4-driven NF-kappa B activation to stimulate virus replication in models of HIV type 1 activation
- PMID: 18184082
- PMCID: PMC4415363
- DOI: 10.1089/aid.2007.0033
Failure of TLR4-driven NF-kappa B activation to stimulate virus replication in models of HIV type 1 activation
Abstract
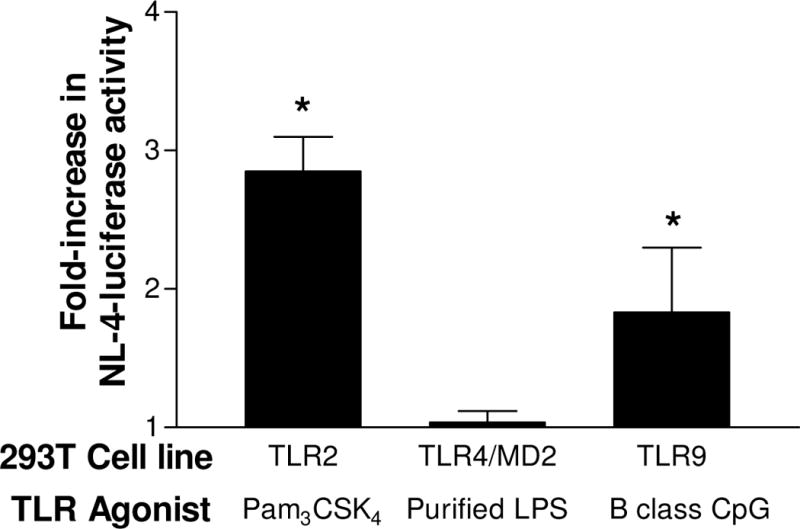
The interaction of HIV-1 with Toll-like receptors (TLR) on host target cells is incompletely understood. Data from several in vivo and in vitro model systems suggest that TLR2, TLR4, and TLR9 remain functional and if stimulated, cause an upregulation of viral replication. In the present studies employing two different chronically HIV-1-infected cell lines and highly purified TLR agonists, we found ligation of TLR2 and TLR9, but not TLR4, resulted in significant upregulation of HIV-1 production. This result was not due to a lack of TLR4 expression or impaired NF-kappa B activation. Using HEK293 cells transfected with individual TLRs and an HIV-1 LTR reporter confirmed that TLR4 signaling does not directly activate the HIV-1 LTR. Finally, ultrapurified LPS did not enhance production of IL-1 beta or IL-6 in chronically infected U1 cells, whereas significant cytokine production was observed in uninfected U937 cells. These results confirm the biological activity of ultrapurified LPS and raise the possibility that TLR4 signaling pathways may be altered during chronic HIV-1 infection. Collectively, these studies suggest that although several TLR can upregulate NF-kappaB in HIV-1-infected cells, upregulation of NF-kappaB alone is insufficient to activate the viral LTR. Further dissection of the TLR signaling pathways is necessary to determine how TLR stimulation leads to LTR activation and whether HIV-1 infection can alter signaling through TLR4.
Figures


Similar articles
-
Toll-like receptor stimulation in cardiomyoctes decreases contractility and initiates an NF-kappaB dependent inflammatory response.Cardiovasc Res. 2006 Dec 1;72(3):384-93. doi: 10.1016/j.cardiores.2006.09.011. Epub 2006 Sep 23. Cardiovasc Res. 2006. PMID: 17054926
-
Toll-like receptors required for dermatophagoides farinae to activate NF-κB.Biol Pharm Bull. 2014;37(1):74-80. doi: 10.1248/bpb.b13-00595. Biol Pharm Bull. 2014. PMID: 24389483
-
Rac1 and Toll-IL-1 receptor domain-containing adapter protein mediate Toll-like receptor 4 induction of HIV-long terminal repeat.J Immunol. 2004 Jun 15;172(12):7642-6. doi: 10.4049/jimmunol.172.12.7642. J Immunol. 2004. PMID: 15187145
-
The Janus face of Bartonella quintana recognition by Toll-like receptors (TLRs): a review.Eur Cytokine Netw. 2008 Sep;19(3):113-8. doi: 10.1684/ecn.2008.0128. Epub 2008 Sep 8. Eur Cytokine Netw. 2008. PMID: 18775802 Review.
-
The Role of Opioid Receptors in Immune System Function.Front Immunol. 2019 Dec 20;10:2904. doi: 10.3389/fimmu.2019.02904. eCollection 2019. Front Immunol. 2019. PMID: 31921165 Free PMC article. Review.
Cited by
-
HIV-1 reactivation induced by the periodontal pathogens Fusobacterium nucleatum and Porphyromonas gingivalis involves Toll-like receptor 2 [corrected] and 9 activation in monocytes/macrophages.Clin Vaccine Immunol. 2010 Sep;17(9):1417-27. doi: 10.1128/CVI.00009-10. Epub 2010 Jul 7. Clin Vaccine Immunol. 2010. PMID: 20610663 Free PMC article.
-
Female Sex Hormones Upregulate the Replication Activity of HIV-1 Sub-Subtype A6 and CRF02_AG but Not HIV-1 Subtype B.Pathogens. 2023 Jun 27;12(7):880. doi: 10.3390/pathogens12070880. Pathogens. 2023. PMID: 37513727 Free PMC article.
-
HIV type 1 infection up-regulates TLR2 and TLR4 expression and function in vivo and in vitro.AIDS Res Hum Retroviruses. 2012 Oct;28(10):1313-28. doi: 10.1089/aid.2011.0297. Epub 2012 Mar 12. AIDS Res Hum Retroviruses. 2012. PMID: 22280204 Free PMC article.
-
Macrophage HIV-1 Gene Expression and Delay Resolution of Inflammation in HIV-Tg Mice.Viruses. 2020 Mar 1;12(3):277. doi: 10.3390/v12030277. Viruses. 2020. PMID: 32121564 Free PMC article.
-
Up-regulation of TLR2 and TLR4 in dendritic cells in response to HIV type 1 and coinfection with opportunistic pathogens.AIDS Res Hum Retroviruses. 2011 Oct;27(10):1099-109. doi: 10.1089/aid.2010.0302. Epub 2011 Apr 20. AIDS Res Hum Retroviruses. 2011. PMID: 21406030 Free PMC article.
References
-
- Blanchard A, Montagnier L, Gougeon ML. Influence of microbial infections on the progression of HIV disease. Trends Microbiol. 1997;5(8):326–331. - PubMed
-
- Wahl SM, Orenstein JM. Immune stimulation and HIV-1 viral replication. J Leukoc Biol. 1997;62(1):67–71. - PubMed
-
- Moriuchi H, Moriuchi M, Mizell SB, Ehler LA, Fauci AS. In vitro reactivation of human immunodeficiency virus 1 from latently infected, resting CD4+ T cells after bacterial stimulation. J Infect Dis. 2000;181(6):2041–2044. - PubMed
Publication types
MeSH terms
Substances
Grants and funding
LinkOut - more resources
Full Text Sources
