. 2008 Jan 9;9(1):R6.
doi: 10.1186/gb-2008-9-1-r6.

Genomic chart guiding embryonic stem cell cardiopoiesis

Affiliations

Genomic chart guiding embryonic stem cell cardiopoiesis

Randolph S Faustino et al. Genome Biol. .

Abstract

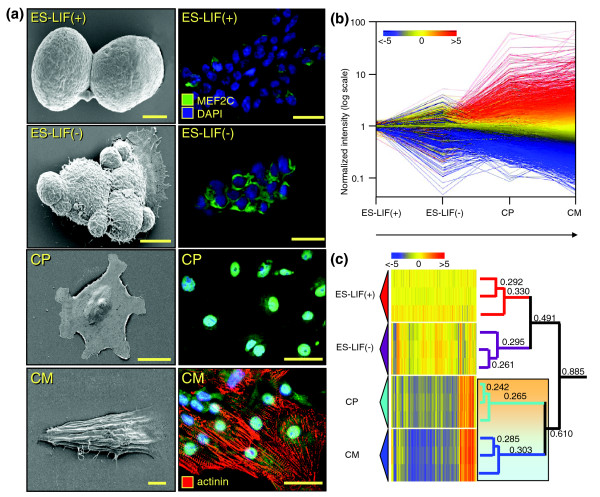
Background: Embryonic stem cells possess a pluripotent transcriptional background with the developmental capacity for distinct cell fates. Simultaneous expression of genetic elements for multiple outcomes obscures cascades relevant to specific cell phenotypes. To map molecular patterns critical to cardiogenesis, we interrogated gene expression in stem cells undergoing guided differentiation, and defined a genomic paradigm responsible for confinement of pluripotency.

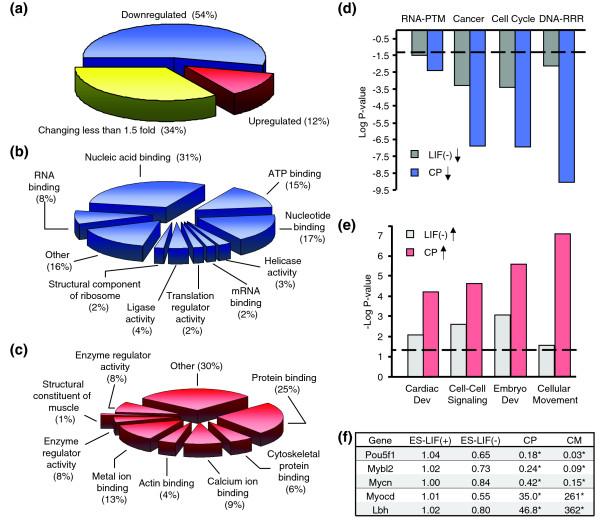
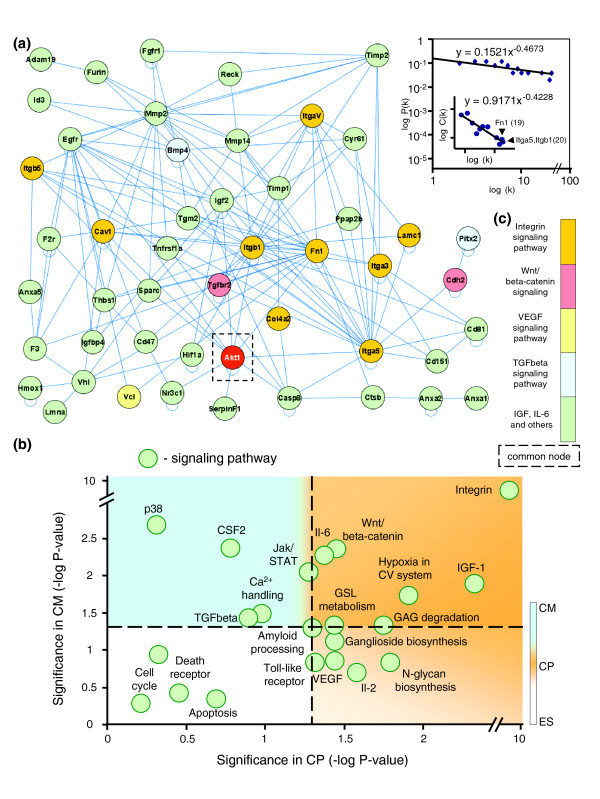
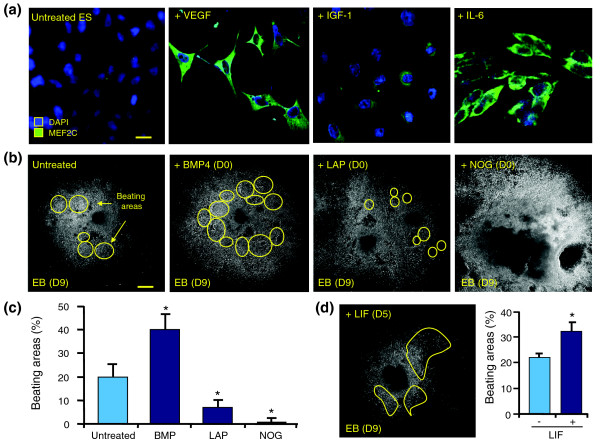
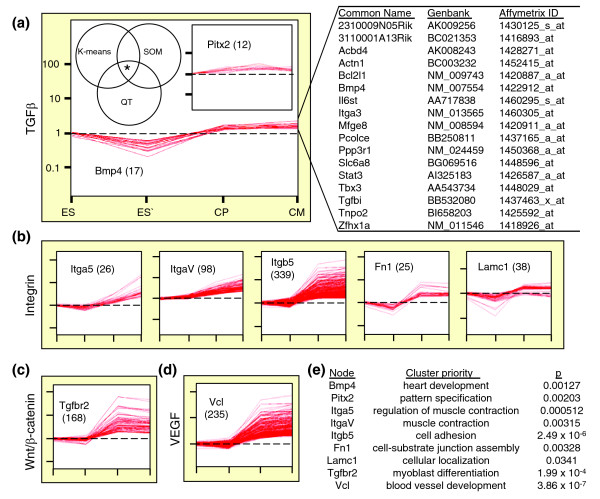
Results: Functional annotation analysis of the transcriptome of differentiating embryonic stem cells exposed downregulated components of DNA replication, recombination and repair machinery, cell cycling, cancer mechanisms, and RNA post-translational modifications. Concomitantly, cardiovascular development, cell-to-cell signaling, cell development and cell movement were upregulated. These simultaneous gene ontology rearrangements engaged a repertoire switch that specified lineage development. Bioinformatic integration of genomic and gene ontology data further unmasked canonical signaling cascades prioritized within discrete phases of cardiopoiesis. Examination of gene relationships revealed a non-stochastic network anchored by integrin, WNT/beta-catenin, transforming growth factor beta and vascular endothelial growth factor pathways, validated by manipulation of selected cascades that promoted or restrained cardiogenic yield. Moreover, candidate genes within anchor pathways acted as nodes that organized correlated expression profiles into functional clusters, which collectively orchestrated and secured an overall cardiogenic theme.

Conclusion: The present systems biology approach reveals a dynamically integrated and tractable gene network fundamental to embryonic stem cell specification, and represents an initial step towards resolution of a genomic cardiopoietic atlas.


Figures

Figure 1
Figure 1
Phenotypic changes and transcriptome dynamism during cardiac stem cell differentiation. (a) Electron microscopy visualized morphological changes occurring during guided stem cell cardiogenesis (left column) with associated expression and distribution of the selected cardiac transcription factor MEF2C and the cardiac contractile protein α-actinin (right column). Cell stage is given in the top left corner of each panel with associated scale bars at the bottom right. First column: ES-LIF(+), 2.5 μm; ES-LIF(-), 5 μm; cardiopoietic cell (CP), 25 μm; cardiomyocyte (CM), 5 μm. All scale bars in the second column indicate 10 μm. Nuclei were counterstained with DAPI. (b) Transcriptional profiling of samples from each stage of stem cell-derived cardiomyocyte formation. Changes in gene expression were plotted on a semi-log scale graph using normalized intensity values as a function of the stage of differentiation. The color scale indicates increased expression (red), no change (yellow) and decreased expression (blue). Associated numbers indicate fold change, where red and blue indicate a respective minimum five-fold up- or downregulation in expression value. (c) Hierarchical clustering of changing genes during differentiation. The condition tree on right illustrates similarity of replicates within each stage. Numbers above branches are the calculated Euclidean distances between the two samples at the left termini. Smaller numbers indicate less dissimilarity between samples while higher numbers indicate an increase in dissimilarity. The shaded box identifies emergence of cardiac specficity (orange, CP) with transition to stem cell derived cardiomyocyte (cyan, CM). The color scale indicates relative changes in gene expression as described previously.
Figure 2
Figure 2
Enrichment analysis of functional groups within the stem cell-derived cardiopoietic transcriptome. (a) Approximately half of all expression profiles in cardiopoietic cells are downregulated while a third do not change more than 1.5-fold compared to unstimulated embryonic stem cells. Upregulated genes account for >10% of all genes. (b, c) Ontological analysis of downregulated and upregulated biological processes in cardiopoietic cells. (d, e) Identification of overrepresented canonical functions in cardiopoietic cells (CP) using Ingenuity Pathways Analysis (IPA) in downregulated and upregulated gene lists. Significance as determined by IPA was plotted as log P value for downregulated genes and -log P value for those upregulated to emphasize direction of change. The dashed line indicates the threshold where the P value = 0.05. Embryonic stem cells in the presence of mitogenic LIF were taken as baseline and significant functional enrichment in cardiopoietic cells are shown in comparison with stem cells cultured without LIF. (f) Gene validation using quantitative PCR. Candidate genes representing pluripotent (Pou5f1), oncogenic (Mybl2, Mycn) and cardiac (Myocd, Lbh) phenotypes were assayed by Taqman. Transcriptional profile changes were expressed as fold change relative to ES-LIF(+). CM, cardiomyocyte.
Figure 3
Figure 3
Cardiovascular development signaling network within cardiopoietic cells. (a) Genes identified in Table 1 integrate into a network suggesting non-stochastic tendencies with emergent scale-free properties (top right). Examples of hubs, with number of first neighbor connections in parentheses, are labeled on the clustering coefficient plot (top right, inset). (b) All upregulated genes in cardiopoietic cells analyzed for enriched functions were further mined to identify top supporting signaling cascades. Individual signaling pathways (green circles) were distributed according to significance during stem cell-derived cardiogenesis, indicating differences in pathway prioritization at discrete stages. The color scale at right indicates progression from embryonic stem cells (ES) through the cardiopoietic stage (CP) to stem cell-derived cardiomyocytes (CM), shown in counterclockwise fashion. CSF, colony stimulating factor; GAG, glycosaminoglycan; GSL, glycosphingolipid. (c) Cross-referencing the signaling cascades represented in (a) with all cardiopoietic pathways identified in (b) converge on integrin, WNT/β-catenin, VEGF, TGFβ and other (IGF, IL6) signaling cascades anchoring the procardiogenic network. A common node shared by these pathways, AKT, is outlined in (a).
Figure 4
Figure 4
Biological validation of cardiogenic network. (a) LIF cultured stem cells were left untreated for 48 h after LIF withdrawal or were treated with VEGF, IGF1 or IL6. Changes in expression of the cardiac transcription factor MEF2C were revealed through immunocytochemistry. Nuclei were counterstained with DAPI. Scale bar: 10 μm. (b) Stem cell-derived embryoid bodies were observed for the formation of beating areas (yellow circles) at day 9 (D9) in untreated, BMP4, LAP and NOG supplemented conditions, with treatments beginning at day zero (D0). Scale bar: 1 μm. (c) Measurement of contractile area activity using Metamorph software. Data reported as mean number of beating areas ± SEM, *P < 0.05, n = 40-50 embryoid bodies. (d) Visualization of beating areas in embryoid bodies treated at day 5 (D5) with LIF, involved in JAK/STAT signaling (left). Evaluation of beating area as a percentage of total area occupied by embryoid body (right). Data reported as mean number of beating areas ± SEM, *P < 0.05, n = 40-50 embryoid bodies.
Figure 5
Figure 5
Nodal network anchors orchestrate coordinated recruitment of specialized ontological classes to secure a developmental theme. (a) Left: a five group K-means algorithm, 4 × 6 SOM, and QT filter were each used to independently dissect the transcriptome of embryonic stem cell (ES) derived cardiogenesis. Cardiopoietic (CP) network nodes previously identified were then used to guide cluster extraction. Bmp4 and Pitx2, members of the TGFβ pathway, are shown as examples. *Venn diagram of K-means, SOM and QT generated lists resolved clustered genes with correlated expression profiles (R = 0.95). For each set, gene (node) identity used to extract associated profiles is indicated, along with number of probes per cluster given in parentheses. Right: genes within the Bmp4 cluster. CM, cardiomyocyte. (b) Nodes belonging to the integrin cascade select discrete clusters with distinct trends. (c, d) Gene groups associated with Tgfbr2 and Vcl nodes that represent WNT/β-catenin and VEGF signaling, respectively. (e) Gene clusters organized functional neighborhoods with ontological priorities, with level of significance indicated on right.

Similar articles

Cited by

References

    1. Rhee H, Polak L, Fuchs E. Lhx2 maintains stem cell character in hair follicles. Science. 2006;312:1946–1949. doi: 10.1126/science.1128004. - DOI - PMC - PubMed
    1. Soen Y, Mori A, Palmer TD, Brown PO. Exploring the regulation of human neural precursor cell differentiation using arrays of signaling microenvironments. Mol Syst Biol. 2006;2:37. doi: 10.1038/msb4100076. - DOI - PMC - PubMed
    1. Suzuki A, Raya Á, Kawakami Y, Morita M, Matsui T, Nakashima K, Gage FH, Rodríguez-Esteban C, Belmonte JCI. Maintenance of embryonic stem cell pluripotency by Nanog-mediated reversal of mesoderm specification. Nat Clin Pract Cardiovasc Med. 2006;3:S114–S122. doi: 10.1038/ncpcardio0442. - DOI - PubMed
    1. Pan G, Thomson JA. Nanog and transcriptional networks in embryonic stem cell pluripotency. Cell Res. 2007;17:42–49. doi: 10.1038/sj.cr.7310125. - DOI - PubMed
    1. Boyer LA, Lee TI, Cole MF, Johnstone SE, Levine SS, Zucker JP, Guenther MG, Kumar RM, Murray HL, Jenner RG. et al.Core transcriptional regulatory circuitry in human embryonic stem cells. Cell. 2005;122:947–956. doi: 10.1016/j.cell.2005.08.020. - DOI - PMC - PubMed

Publication types