Comparative Study
. 2008 Mar;82(6):2975-88.
doi: 10.1128/JVI.02216-07. Epub 2008 Jan 9.

Differential CD4+ versus CD8+ T-cell responses elicited by different poxvirus-based human immunodeficiency virus type 1 vaccine candidates provide comparable efficacies in primates

Affiliations
Comparative Study

Differential CD4+ versus CD8+ T-cell responses elicited by different poxvirus-based human immunodeficiency virus type 1 vaccine candidates provide comparable efficacies in primates

Petra Mooij et al. J Virol. 2008 Mar.

Abstract

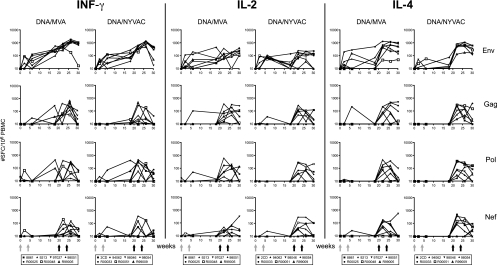
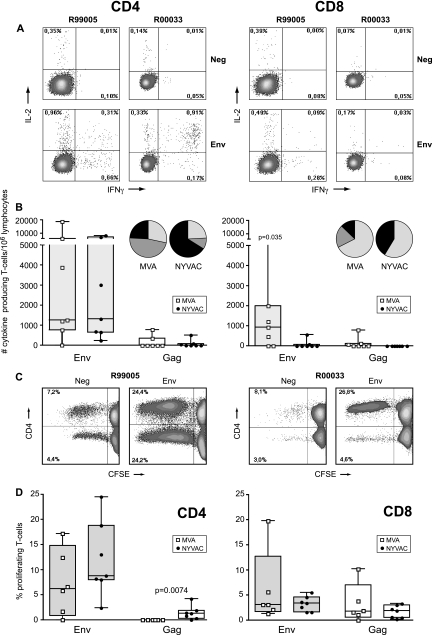
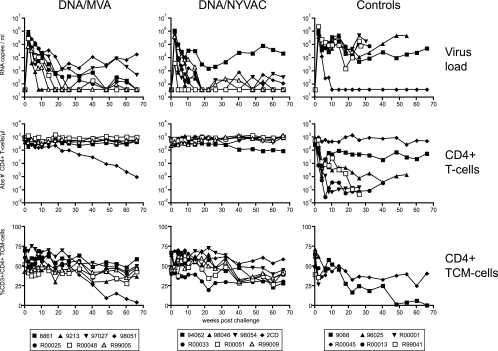
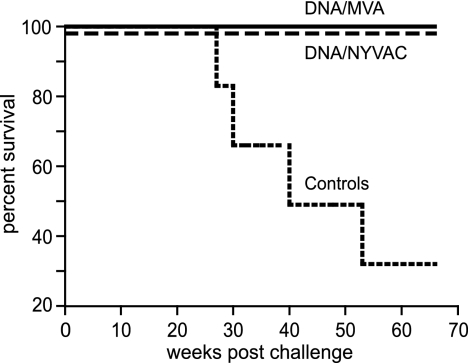
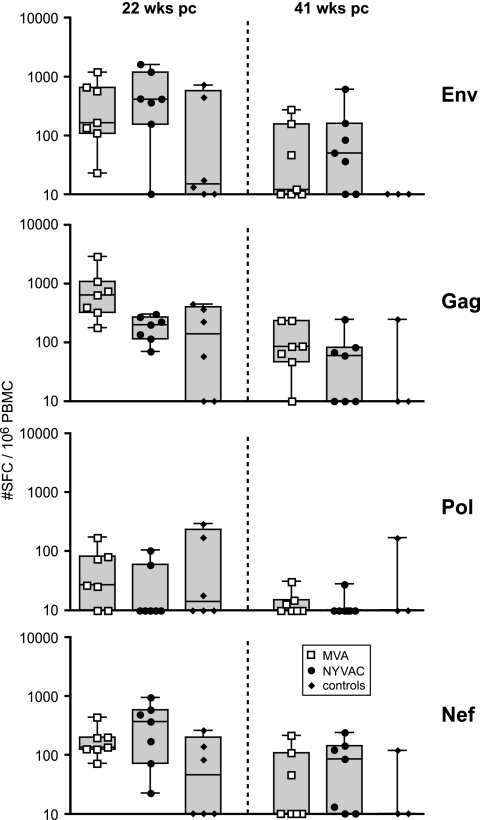
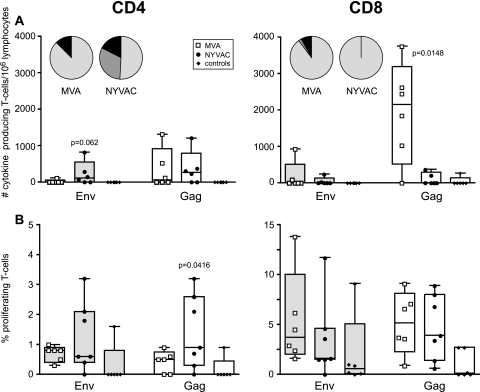
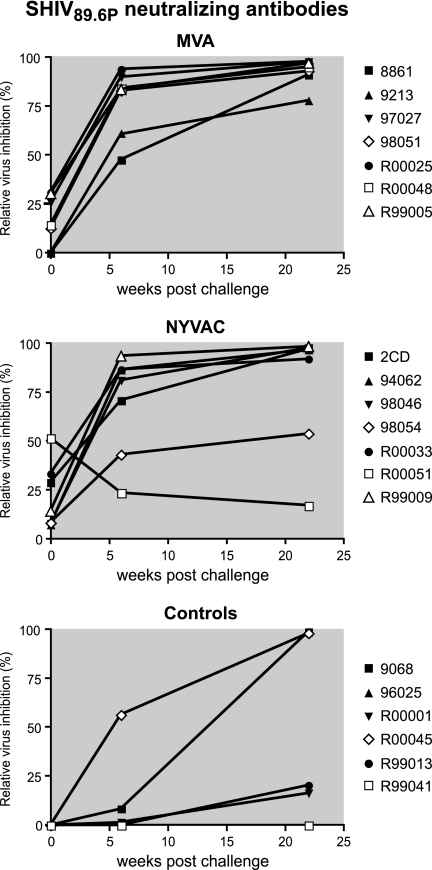
Poxvirus vectors have proven to be highly effective for boosting immune responses in diverse vaccine settings. Recent reports reveal marked differences in the gene expression of human dendritic cells infected with two leading poxvirus-based human immunodeficiency virus (HIV) vaccine candidates, New York vaccinia virus (NYVAC) and modified vaccinia virus Ankara (MVA). To understand how complex genomic changes in these two vaccine vectors translate into antigen-specific systemic immune responses, we undertook a head-to-head vaccine immunogenicity and efficacy study in the pathogenic HIV type 1 (HIV-1) model of AIDS in Indian rhesus macaques. Differences in the immune responses in outbred animals were not distinguished by enzyme-linked immunospot assays, but differences were distinguished by multiparameter fluorescence-activated cell sorter analysis, revealing a difference between the number of animals with both CD4(+) and CD8(+) T-cell responses to vaccine inserts (MVA) and those that elicit a dominant CD4(+) T-cell response (NYVAC). Remarkably, vector-induced differences in CD4(+)/CD8(+) T-cell immune responses persisted for more than a year after challenge and even accompanied antigenic modulation throughout the control of chronic infection. Importantly, strong preexposure HIV-1/simian immunodeficiency virus-specific CD4(+) T-cell responses did not prove deleterious with respect to accelerated disease progression. In contrast, in this setting, animals with strong vaccine-induced polyfunctional CD4(+) T-cell responses showed efficacies similar to those with stronger CD8(+) T-cell responses.


Figures

FIG. 1.
FIG. 1.
Schematic representation of the Gag-Pol-Nef polyprotein and Env protein in relation to the SIVmac239 virus genome and the peptide pools used for the analysis of immune responses. Different genes are indicated by different colors (gag in red, pol in blue, nef in green, and env in yellow). A detailed description of the construction can be found in Materials and Methods. LTR, long terminal repeat; GAG, group specific antigen; POL, polymerase; VIF, virion infectivity factor; VPR, viral protein regulator; VPU, viral protein unknown; TAT, transactivator of viral transcription; REV, regulator of viral protein expression; NEF, negative factor; PROT, protease; RT, reverse transcriptase; INT, integrase; ENV, envelope.
FIG. 2.
FIG. 2.
T-cell ELISpot responses elicited over time. Shown are IFN-γ (left panels), IL-2 (middle panels), and IL-4 (right panels) ELISpots from individual animals immunized with SHIV immunogens delivered by DNA/MVA or DNA/NYVAC to HIV-189.6P Env and SIVmac239 Gag, Pol, and Nef peptides. Background responses (mean numbers of SFC plus twice the standard deviations of triplicate assays with medium alone) were subtracted. Responses are presented as the number of SFC per 106 PBMC. Arrows indicate immunization time points at weeks 0, 4 (DNA), 20, and 24 (poxvirus).
FIG. 3.
FIG. 3.
Vaccine-induced antigen-specific CD4+ and CD8+ T-cell responses 2 weeks prior to challenge. (A) Representative flow cytometry profiles of vaccine-induced CD4+ (left) and CD8+ (right) T-cell responses directed against Env in monkeys R99005 and R00033 immunized with SHIV immunogens delivered by DNA/MVA or DNA/NYVAC, respectively. CD4 and CD8 T-cell responses were defined using polychromatic flow cytometry. Blood mononuclear cells were stimulated with the relevant peptide pools and stained with CD4, CD8, IFN-γ, and IL-2 antibodies. (B) Cytokine production by CD4+ (left) and CD8+ (right) T cells of all individual animals immunized with SHIV immunogens delivered by DNA/MVA (open squares) or DNA/NYVAC (black dots) to HIV-189.6p Env (gray boxes) and SIVmac239 Gag peptides (clear boxes) as measured by ICS assays 2 weeks before challenge. Box-whisker plots indicate the interquartile ranges and the medians (horizontal lines) of the groups. Responses are presented as the numbers of cytokine-producing CD3+ T cells per 106 lymphocytes. Pie charts represent the average response for all animals of each group of the CD4+ and CD8+ HIV-189.6p Env- and SIVmac239 Gag-specific T-cell responses grouped by function (expressing either one cytokine, IFN-γ [light gray] or IL-2 [dark gray], or the two simultaneously [black]) relative to the total antigen-specific response. (C) Representative flow cytometry profiles of CFSE-labeled PBMC of monkeys R99005 and R00033 immunized with SHIV immunogens delivered by DNA/MVA or DNA/NYVAC, respectively, unstimulated (Neg) or stimulated with Env peptides, cultured for 6 days, and stained with CD3, CD4, and CD8 antibodies. (D) Percentage of antigen-specific proliferating CD4+ and CD8+ T cells of all individual animals (dots) immunized with SHIV immunogens delivered by DNA/MVA (open squares) or DNA/NYVAC (black dots) to HIV-189.6p Env (gray boxes) and SIVmac239 Gag peptides (clear boxes) 2 weeks before challenge. Responses are presented as percentages of proliferating (CFSE low) CD3+/CD4+ and CD3+/CD8+ T cells. Background responses (medium alone) were subtracted.
FIG. 4.
FIG. 4.
Vaccine efficacy. The viral RNA load (top), absolute number of circulating CD4+ T cells (middle), and percentage of CD4+ Tcm cells (bottom) after the challenge of each individual animal are presented. The left column represents results from animals immunized with SHIV immunogens delivered by DNA/MVA, the middle column shows results from animals immunized with SHIV immunogens delivered by DNA/NYVAC, and the right column presents results from control animals.
FIG. 5.
FIG. 5.
Survival. The percentages of animals that remained disease free after SHIV89.6P challenge are shown. The animals were immunized with SHIV immunogens delivered by DNA/MVA (solid line) or DNA/NYVAC (dashed line) or were control animals (declining line).
FIG. 6.
FIG. 6.
T-cell ELISpot responses after challenge. IFN-γ production by PBMC of individual control animals (black diamonds) or animals immunized with SHIV immunogens delivered by DNA/MVA (open squares) or DNA/NYVAC (black dots) to HIV-189.6P Env and SIVmac239 Gag, Pol, and Nef peptides at 22 weeks after challenge (pc) (left panels) and at 41 weeks after challenge (right panels). Box-whisker plots indicate the interquartile ranges and the medians (horizontal lines) of the groups. Background responses (mean numbers of SFC plus twice the standard deviations of triplicate assays with medium alone) were subtracted. Responses are presented as the number of SFC per 106 PBMC.
FIG. 7.
FIG. 7.
Antigen-specific CD4+ and CD8+ T-cell responses at the time of euthanasia. (A) Cytokine production by CD4+ (left) and CD8+ (right) T cells of control animals (black diamonds) or individual animals (dots) immunized with SHIV immunogens delivered by DNA/MVA (open squares) or DNA/NYVAC (black dots) to HIV-189.6p Env (gray boxes) and SIVmac239 Gag peptides (clear boxes) as measured by ICS assays at the time of euthanasia. Box-whisker plots indicate the interquartile ranges and the medians (horizontal lines) of the groups. Responses are presented as the number of cytokine-producing CD3+ T cells per 106 lymphocytes. Pie charts represent the average response for all animals of each group of the CD4+ and CD8+ HIV-189.6p Env- and SIVmac239 Gag-specific T-cell responses grouped by function (expressing either one cytokine, IFN-γ [light gray] or IL-2 [dark gray], or the two simultaneously [black]) relative to the total antigen-specific response. (B) Percentage of antigen-specific proliferating CD4+ (left) and CD8+ (right) T cells of control animals (black diamonds) or individual animals (dots) immunized with SHIV immunogens delivered by DNA/MVA (open squares) or DNA/NYVAC (black dots) to HIV-189.6p Env (gray boxes) and SIVmac239 Gag peptides (clear boxes). Responses are presented as the percentage of proliferating (CFSE low) CD3+/CD4+ and CD3+/CD8+ T cells. Background responses (medium alone) were subtracted. Statistically significant differences between immunization groups are given by showing the P values (Mann-Whitney test).
FIG. 8.
FIG. 8.
Neutralizing antibody titers. Relative inhibition of virus infection of indicator cells with the challenge virus SHIV89.6p is shown. The infection of indicator cells with virus incubated with individual sera from before immunization or before challenge (controls) was set at 0% inhibition.

References

    1. Albert, M. L. 2004. Death-defying immunity: do apoptotic cells influence antigen processing and presentation? Nat. Rev. Immunol. 4223-231. - PubMed
    1. Amara, R. R., C. Ibegbu, F. Villinger, D. C. Montefiori, S. Sharma, P. Nigam, Y. Xu, H. M. McClure, and H. L. Robinson. 2005. Studies using a viral challenge and CD8 T cell depletions on the roles of cellular and humoral immunity in the control of an SHIV-89.6P challenge in DNA/MVA-vaccinated macaques. Virology 343246-255. - PubMed
    1. Amara, R. R., K. Patel, G. Niedziela, P. Nigam, S. Sharma, S. I. Staprans, D. C. Montefiori, L. Chenareddi, J. G. Herndon, H. L. Robinson, H. M. McClure, and F. J. Novembre. 2005. A combination DNA and attenuated simian immunodeficiency virus vaccine strategy provides enhanced protection from simian/human immunodeficiency virus-induced disease. J. Virol. 7915356-15367. - PMC - PubMed
    1. Amara, R. R., F. Villinger, J. D. Altman, S. L. Lydy, S. P. O'Neil, S. I. Staprans, D. C. Montefiori, Y. Xu, J. G. Herndon, L. S. Wyatt, M. A. Candido, N. L. Kozyr, P. L. Earl, J. M. Smith, H. L. Ma, B. D. Grimm, M. L. Hulsey, J. Miller, H. M. McClure, J. M. McNicholl, B. Moss, and H. L. Robinson. 2001. Control of a mucosal challenge and prevention of AIDS by a multiprotein DNA/MVA vaccine. Science 29269-74. - PubMed
    1. Anel, A., A. Bosque, J. Naval, A. Pineiro, L. Larrad, M. A. Alava, and M. J. Martinez-Lorenzo. 2007. Apo2L/TRAIL and immune regulation. Front. Biosci. 122074-2084. - PubMed

Publication types