. 2008 Jan 9;28(2):395-406.
doi: 10.1523/JNEUROSCI.3796-07.2008.

Activity-dependent suppression of miniature neurotransmission through the regulation of DNA methylation

Affiliations

Activity-dependent suppression of miniature neurotransmission through the regulation of DNA methylation

Erika D Nelson et al. J Neurosci. .

Abstract

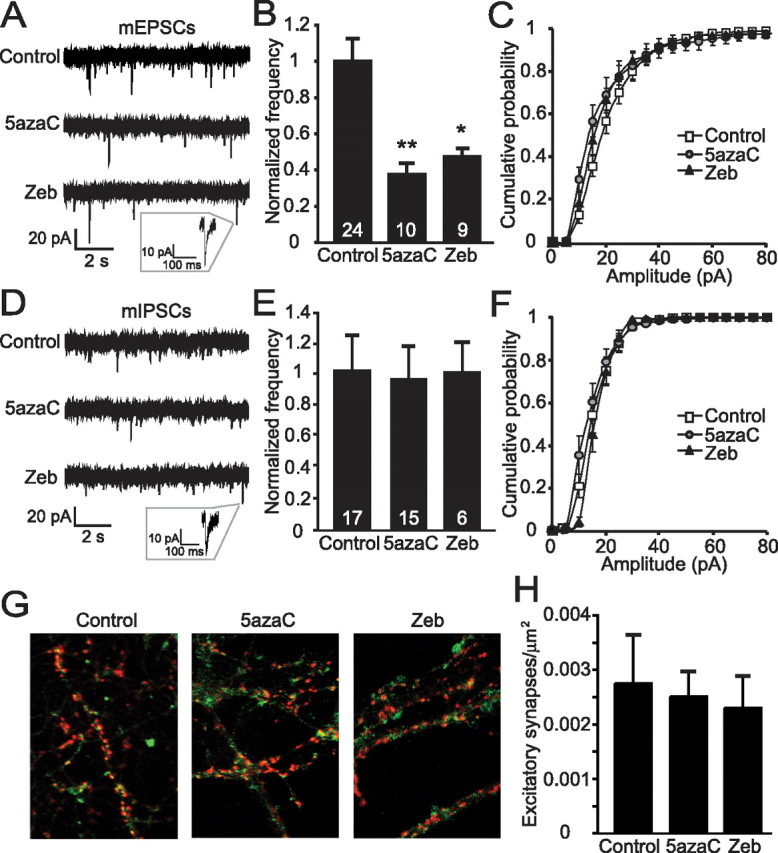
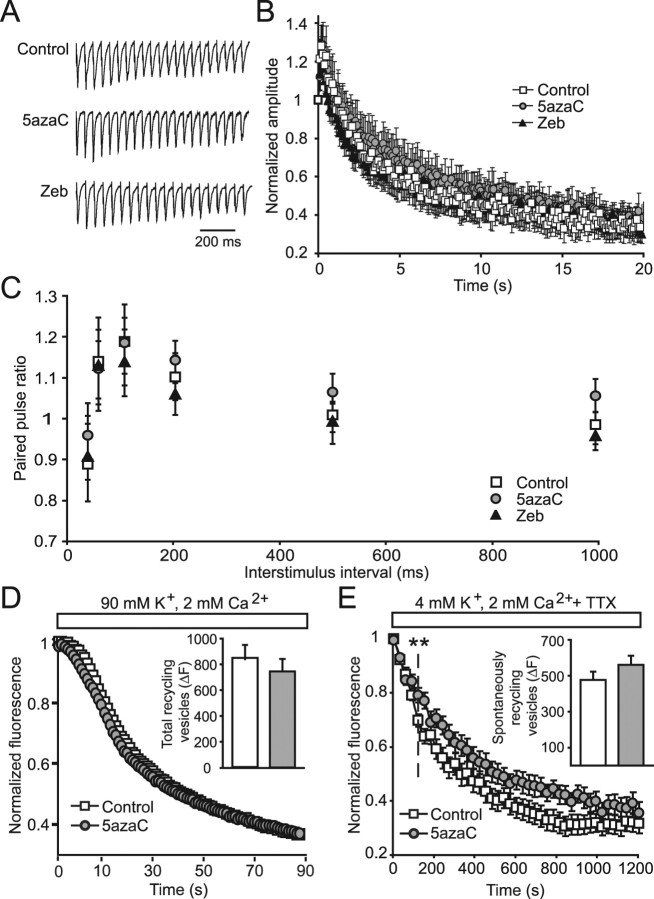
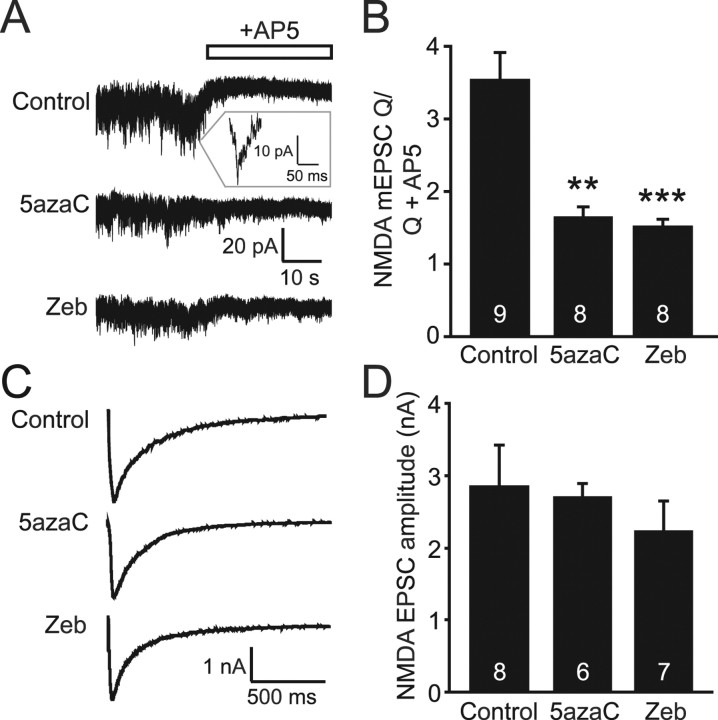
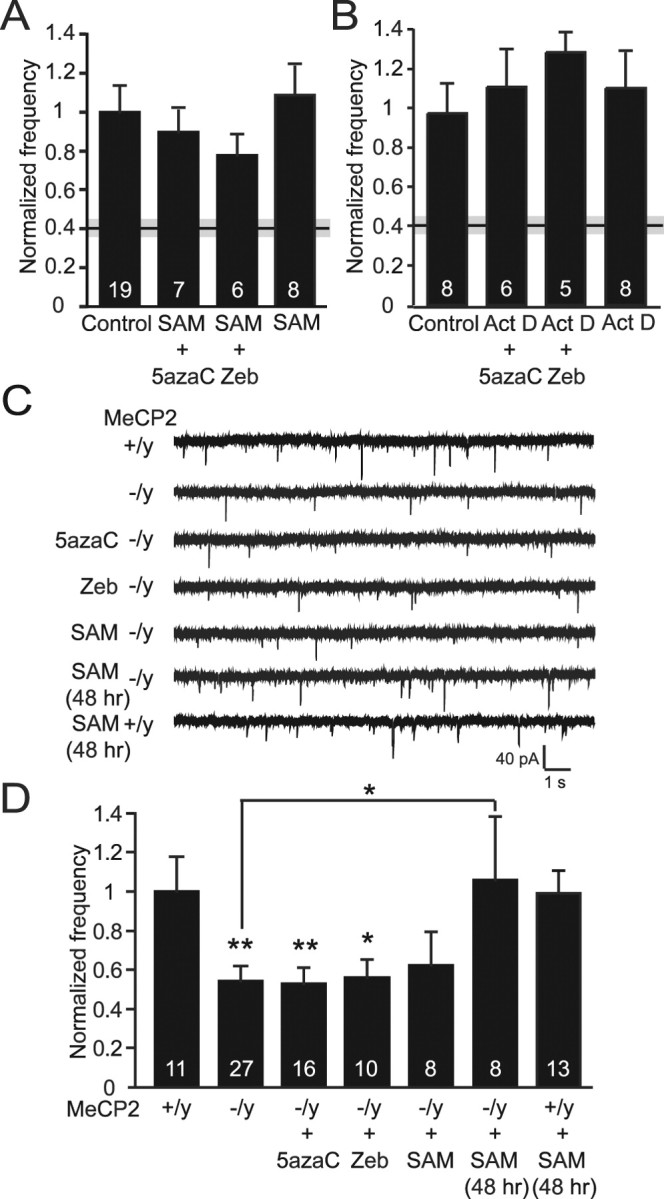
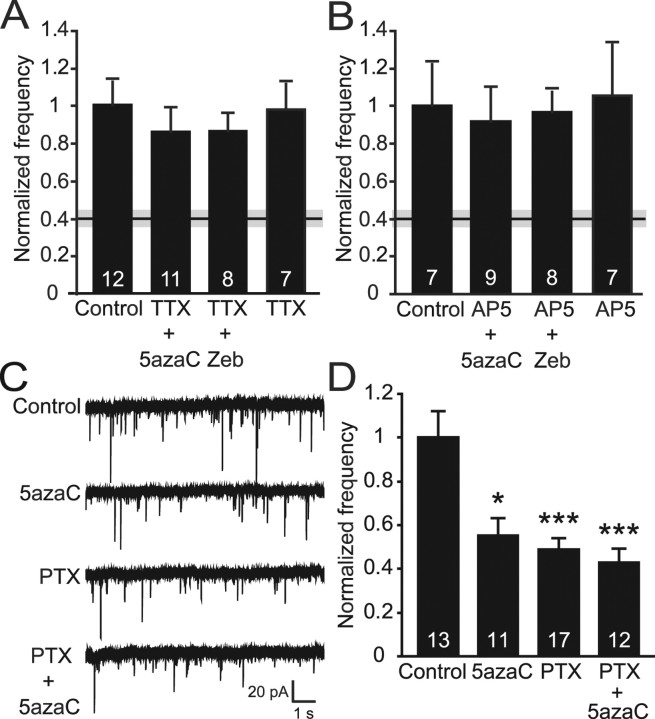
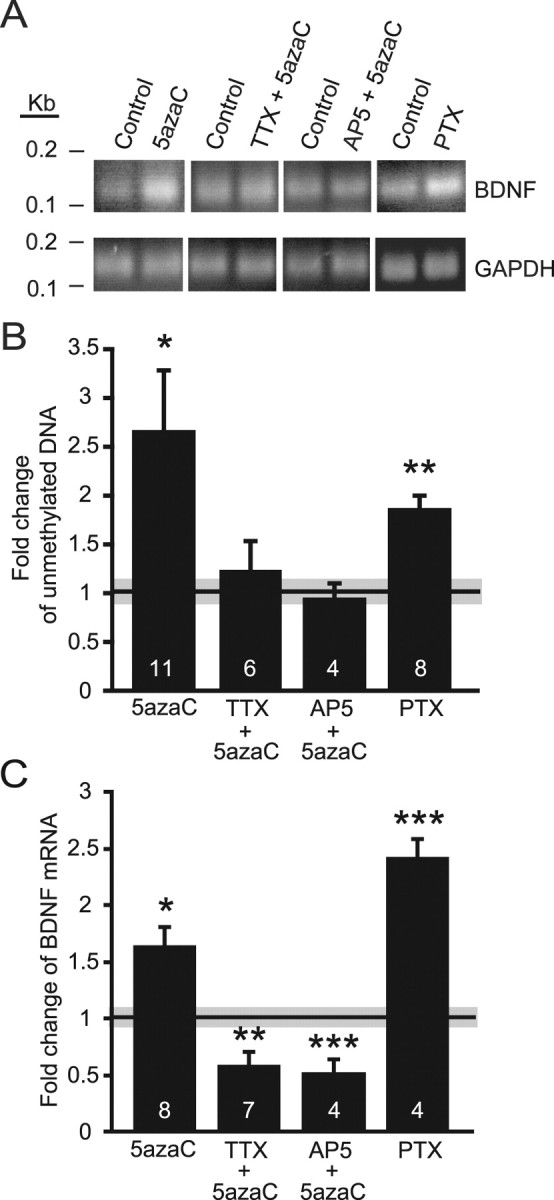
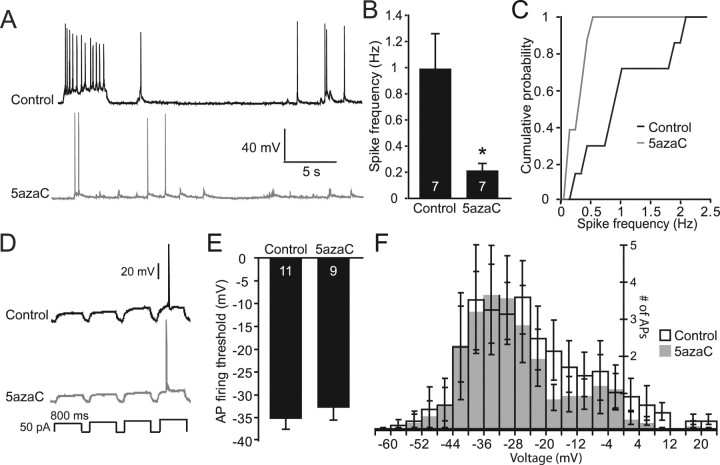
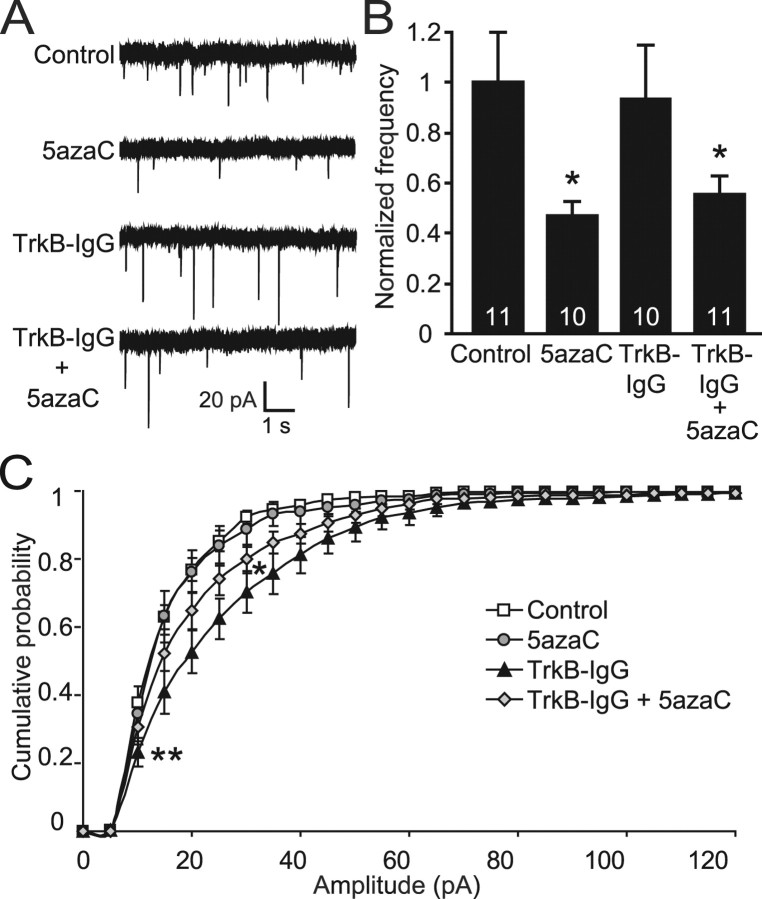
DNA methylation is an epigenetic mechanism that plays a critical role in the repression of gene expression. Here, we show that DNA methyltransferase (DNMT) inhibition in hippocampal neurons results in activity-dependent demethylation of genomic DNA and a parallel decrease in the frequency of miniature EPSCs (mEPSCs), which in turn impacts neuronal excitability and network activity. Treatment with DNMT inhibitors reveals an activity-driven demethylation of brain-derived neurotrophic factor promoter I, which is mediated by synaptic activation of NMDA receptors, because it is susceptible to AP-5, a blocker of NMDA receptors. The specific effect of DNMT inhibition on spontaneous excitatory neurotransmission requires gene transcription and is occluded in the absence of the transcriptional repressor methyl-CpG-binding protein 2 (MeCP2). Interestingly, enhancing excitatory activity, in the absence of DNMT inhibitors, also produces similar decreases in DNA methylation and mEPSC frequency, suggesting a role for DNA methylation in the control of homeostatic synaptic plasticity. Furthermore, adding excess substrate for DNA methylation (S-adenosyl-L-methionine) rescues the suppression of mEPSCs by DNMT inhibitors in wild-type neurons, as well as the defect seen in MeCP2-deficient neurons. These results uncover a means by which NMDA receptor-mediated synaptic activity drives DNA demethylation within mature neurons and suppresses basal synaptic function.


Figures

Figure 1.
Figure 1.
Inhibiting DNMT activity in neurons causes a deficit in excitatory synaptic transmission. A, Sample traces of mEPSCs recorded from mature hippocampal cultures treated 24 h with DNMT inhibitors 5azaC (2.5 μm) and Zeb (50 μm). B, Bar graph showing a decrease in the frequencies of mEPSCs recorded from 5azaC- and Zeb-treated neurons compared with controls (**p < 0.01; *p < 0.05). The numbers on the bars indicate the number of experiments (B, E). C, Histograms of mEPSC amplitudes show no differences among control, 5azaC, or Zeb treatments. D, Sample recordings of mIPSCs from cultures treated with inhibitors of DNMT activity. E, Bar graph depicts no change in mIPSC frequencies from 5azaC- or Zeb-treated neurons compared with controls. F, Cumulative histograms of mIPSC amplitudes show no differences between control and DNMT inhibitor-treated neurons. G, Dissociated hippocampal cultures were immunostained with antibodies to Synapsin (red) and PSD-95 (green) to determine the number of excitatory synapses. H, The bar graph shows no alterations in excitatory synapse number among control, 5azaC-treated, or Zeb-treated cultures.
Figure 2.
Figure 2.
DNMT inhibition for 24 h specifically affects spontaneous presynaptic function. A, Normalized sample traces of the first 20 evoked EPSCs, recorded in the presence of PTX, in response to 10 Hz field stimulation from neurons treated with inhibitors of DNMTs. B, Average normalized EPSC amplitudes from treated neurons measured during 20 s of 10 Hz stimulation show no alterations in response depression after treatment with DNMT inhibitors compared with controls (control, n = 15; 5azaC, n = 14; Zeb, n = 12). C, Paired-pulse ratios of the first two evoked EPSCs in response to various stimulation frequencies were not significantly different in DNMT inhibitor-treated neurons compared with controls. D, Total synaptic vesicle pools were loaded with FM1-43 by 47 mm K+-induced depolarization and destained using 90 mm K+. The kinetics of destaining was not different between control and 5azaC-treated neurons. Inset, The bar graph depicts no change in total recycling synaptic vesicles from control and 5azaC-treated synapses measured by the total change in fluorescence during 90 mm K+ destaining (control, n = 8 coverslips; 5azaC, n = 8 coverslips). E, Spontaneously recycling synaptic vesicles were loaded for 15 min in the presence of TTX and destained for 20 min in the same manner. Destaining of spontaneous vesicles was slower in 5azaC-treated synapses compared with controls (**p < 0.01). Inset, The bar graph indicates no difference in the numbers of spontaneously recycling synaptic vesicles between control and DNMT inhibitor-treated neurons (control, n = 6; 5azaC, n = 5).
Figure 3.
Figure 3.
Spontaneous NMDA mEPSCs are decreased after inhibition of DNMTs. A, Sample traces of whole-cell voltage-clamp recordings of NMDA mEPSCs done in the presence of CNQX, PTX, strychnine, glycine, and TTX. AP-5 was then washed on to determine baseline noise levels. B, Bar graph demonstrating that both 5azaC and Zeb treatments resulted in significant decreases in the amount of mEPSC charge (Q) per 10 s intervals divided by the baseline amount of Q after AP-5 was added. **p < 0.01; ***p < 0.001. C, Sample traces of evoked NMDA EPSCs recorded from treated neurons. D, Bar graph showing no changes in average EPSC amplitudes after treatment with DNMT inhibitors. The numbers on the bars indicate the number of experiments (B, D).
Figure 4.
Figure 4.
Changes in spontaneous excitatory neurotransmission after DNMT inhibition are mediated by the loss of function of the transcriptional repressor MeCP2. A, Bar graph demonstrating that cotreatment with DNMT inhibitors and the methyl donor, SAM, or treatment with SAM alone, results in no alterations in mEPSC frequency compared with controls. The black and gray bar indicating the mean ± SEM for 5azaC treatment is shown for comparison. B, Bar graph revealing no changes in mEPSC frequencies when neurons were treated with DNMT inhibitors in combination with the inhibitor of transcriptional activation, Act D, suggesting that gene transcription is required for the deficit seen with DNMT inhibitor treatment alone. The black and gray bar indicating the mean ± SEM depicts the 5azaC result. C, Representative traces of mEPSCs recorded from MeCP2-deficient neurons. D, Bar graph showing a significant decrease in mEPSC frequency in MeCP2 knock-out (−/y) neurons compared with wild-type (+/y) littermate controls. A decrease in frequency is also seen after 24 h treatments of knock-out neurons with 5azaC, Zeb, or SAM. However, a 48 h application of SAM onto MeCP2-deficient neurons was able to significantly reverse this frequency deficit compared with control-treated knock-out neurons (**p < 0.01; *p < 0.05). The numbers on the bars indicate the number of experiments (A, B, D).
Figure 5.
Figure 5.
Treatment of hippocampal cultures with DNMT inhibitors reveals activity-dependent alterations in synaptic transmission. A, Bar graph shows no changes in mEPSC frequency when cultures were treated with DNMT inhibitors in the presence of TTX, suggesting that neuronal activity is required for the decrease in frequency seen with DNMT inhibitor treatment alone (black and gray bar indicates mean ± SEM). B, Bar graph indicates no difference in the frequencies of mEPSCs when 5azaC and Zeb treatments included the NDMA antagonist AP-5. The black and gray bar indicating the mean ± SEM is the result of 5azaC treatment alone. C, Representative traces of mEPSCs recorded after 48 h treatments with PTX and 5azaC. D, Bar graph depicts a decrease in mEPSC frequency after PTX treatment that mimics that seen after treatment with 5azaC. There was no further decrease in mEPSC frequency when the treatments were combined (***p < 0.001; *p < 0.05). The numbers on the bars indicate the number of experiments (A, B, D).
Figure 6.
Figure 6.
Demethylation of BDNF promoter I and increased BDNF mRNA expression occurs after DNMT inhibition and both are dependent on synaptic activity. A, Bisulfite modification of genomic DNA followed by quantitative PCR (Q-PCR) to measure levels of unmethylated BNDF promoter I. Representative gel electrophoresis of Q-PCR results after control, PTX, and 5azaC treatments with and without TTX or AP-5. B, Bar graph shows a significant increase in the level of unmethylated BDNF promoter I after 5azaC and PTX treatments compared with controls (black and gray bar indicates mean ± SEM) but no changes in the level of unmethylation when 5azaC treatments were in combination with TTX or AP-5 (*p < 0.05; **p < 0.01). C, Bar graph showing increased BDNF mRNA in response to both 5azaC and PTX treatments and decreased expression with 5azaC plus TTX or AP-5 cotreatments (*p < 0.05; **p < 0.01; ***p < 0.001). The numbers on the bars indicate the number of experiments (B, C).
Figure 7.
Figure 7.
Spontaneous synaptic firing is reduced after inhibition of DNMT activity. A, Sample current-clamp recordings from 5azaC- and control-treated hippocampal cultures. B, Bar graph depicting a fivefold decrease in mean spontaneous firing rates after DNMT inhibition (*p < 0.05). C, Cumulative probability graph reveals decreased firing rates in all recorded neurons after 5azaC treatment compared with controls. D, Sample recordings showing similar increases in voltage and firing of APs in response to increasing current injections. E, Bar graph showing no difference in AP firing threshold between neurons treated with DNMT inhibitor and controls. F, Histogram demonstrating no significant differences between control and 5azaC-treated neurons in the numbers of APs fired in response to depolarizing voltage changes. The numbers on the bars indicate the number of experiments (B, E).
Figure 8.
Figure 8.
The decrease in mEPSC frequency seen after DNMT inhibition is not mediated by enhanced BDNF signaling. A, Sample traces of mEPSCs recorded from neurons treated with TrkB-IgG antibodies in the presence and absence of DNMT inhibitors. B, Bar graph shows a significant decrease in mEPSC frequency with both 5azaC alone and TrkB-IgG plus 5azaC treatments (*p < 0.05). The number on the bars indicate the number of experiments. C, Cumulative histogram of mEPSC amplitudes reveals a significant increase after TrkB-IgG treatment and a somewhat smaller, but still significant, increase when neurons were exposed to TrkB-IgG in the presence of the DNMT inhibitor 5azaC (*p < 0.05; **p < 0.01).

References

    1. Akaneya Y, Tsumoto T, Kinoshita S, Hatanaka H. Brain-derived neurotrophic factor enhances long-term potentiation in rat visual cortex. J Neurosci. 1997;17:6707–6716. - PMC - PubMed
    1. Amir RE, Van den Veyver IB, Wan M, Tran CQ, Francke U, Zoghbi HY. Rett syndrome is caused by mutations in X-linked MECP2, encoding methyl-CpG-binding protein 2. Nat Genet. 1999;23:185–188. - PubMed
    1. Barreto G, Schafer A, Marhold J, Stach D, Swaminathan SK, Handa V, Doderlein G, Maltry N, Wu W, Lyko F, Niehrs C. Gadd45a promotes epigenetic gene activation by repair-mediated DNA demethylation. Nature. 2007;445:671–675. - PubMed
    1. Betz WJ, Mao F, Smith CB. Imaging exocytosis and endocytosis. Curr Opin Neurobiol. 1996;6:365–371. - PubMed
    1. Bito H, Deisseroth K, Tsien RW. Ca2+-dependent regulation in neuronal gene expression. Curr Opin Neurobiol. 1997;7:419–429. - PubMed

Publication types

MeSH terms

LinkOut - more resources