. 2008 Jan 9;28(2):456-64.
doi: 10.1523/JNEUROSCI.2735-07.2008.

Effects of pH buffering on horizontal and ganglion cell light responses in primate retina: evidence for the proton hypothesis of surround formation

Affiliations

Effects of pH buffering on horizontal and ganglion cell light responses in primate retina: evidence for the proton hypothesis of surround formation

Christopher M Davenport et al. J Neurosci. .

Abstract

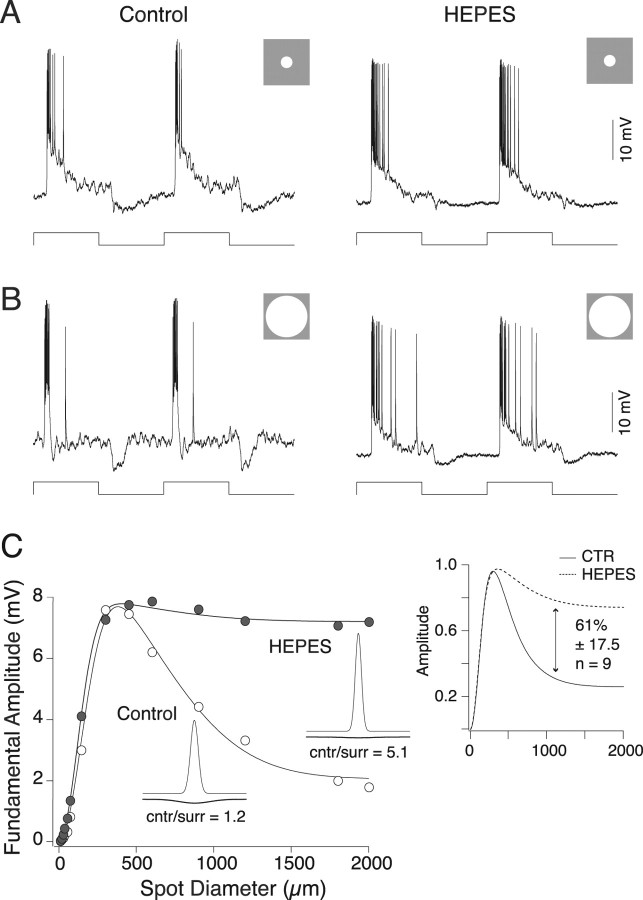
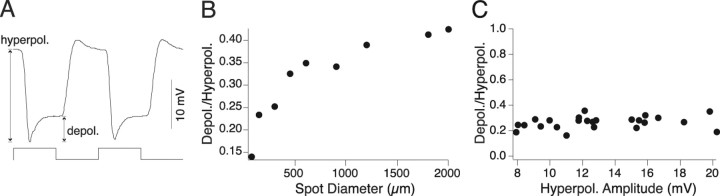
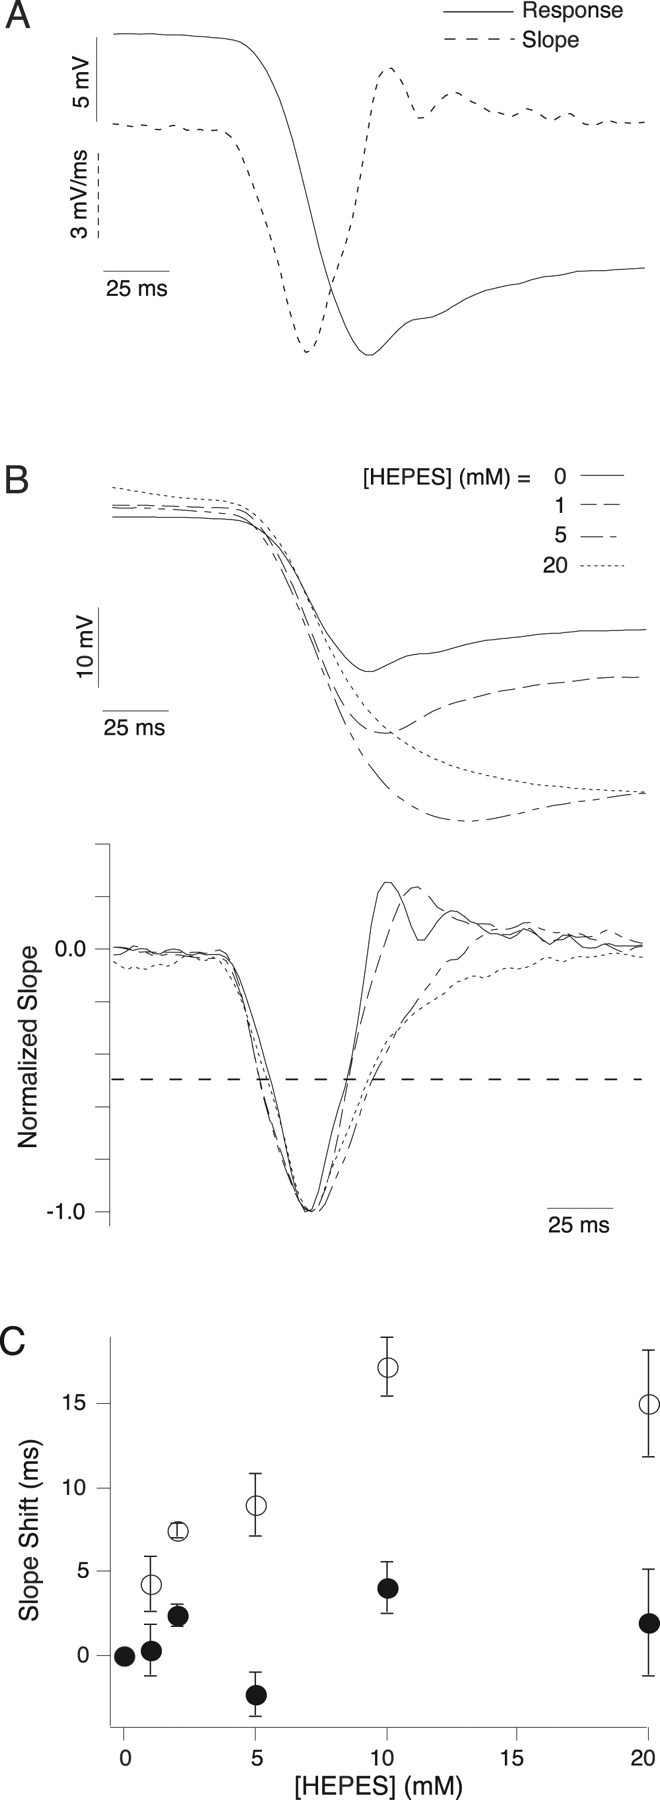
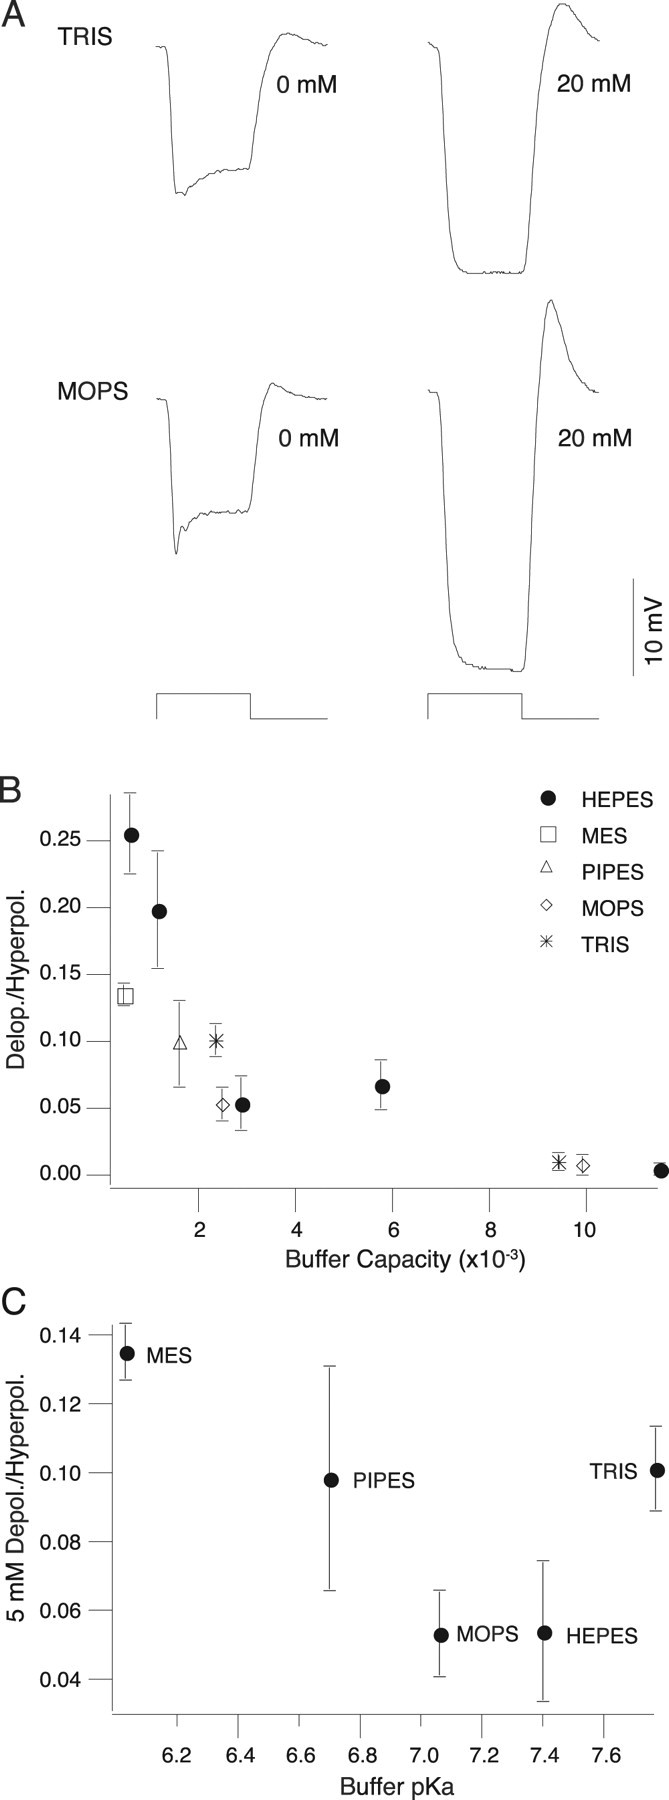
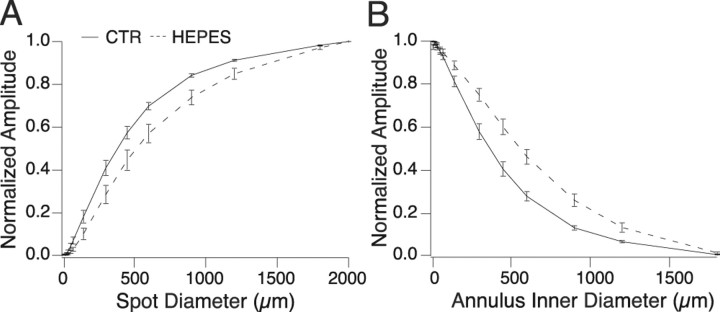
Negative feedback from horizontal cells to cone photoreceptors is regarded as the critical pathway for the formation of the antagonistic surround of retinal neurons, yet the mechanism by which horizontal cells accomplish negative feedback has been difficult to determine. Recent evidence suggests that feedback uses a novel, non-GABAergic pathway that directly modulates the calcium current in cones. In non-mammalian vertebrates, enrichment of retinal pH buffering capacity attenuates horizontal cell feedback, supporting one model in which feedback occurs by horizontal cell modulation of the extracellular pH in the cone synaptic cleft. Here we test the effect of exogenous pH buffering on the response dynamics of H1 horizontal cells and the center-surround receptive field structure of parasol ganglion cells in the macaque monkey retina. Enrichment of the extracellular buffering capacity with HEPES selectively attenuates surround antagonism in parasol ganglion cells. The H1 horizontal cell light response includes a slow, depolarizing component that is attributed to negative feedback to cones. This part of the response is attenuated by HEPES and other pH buffers in a dose-dependent manner that is correlated with predicted buffering capacity. The selective effects of pH buffering on the parasol cell surround and H1 cell light response suggests that, in primate retina, horizontal cell feedback to cones is mediated via a pH-dependent mechanism and is a major determinant of the ganglion cell receptive field surround.


Figures

Figure 1.
Figure 1.
HEPES attenuates parasol ganglion cell surround. A, Responses of an ON parasol ganglion cell to a 300-μm-diameter spot (stimulus trace below) square wave stimulus modulated at 2 Hz in the absence (left) and presence (right) of 20 mm HEPES. The responses are similar in both conditions. B, Responses of a parasol ganglion cell to a 2000-μm-diameter spot (stimulus trace below) square wave stimulus modulated at 2 Hz in the absence (left) and presence (right) of HEPES. The control response is small and transient because of surround antagonism. The response in HEPES is larger and more sustained, indicating diminished surround antagonism. C, Response amplitude as a function of spot diameter in the absence (open circles) and presence (filled circles) of 20 mm HEPES. Stimuli were spots sinusoidally modulated at 2 Hz. Solid lines are difference of Gaussian receptive field model fits to the data; insets are two-dimensional profiles of the model fits. Responses at small spot diameters are similar, but responses at larger spot diameters are larger in the presence of HEPES, and the ratio of center to surround (cntr/surr) response strength increases. The inset on the right shows the mean response normalized to the maximum amplitude for nine cells in the absence (solid line) and presence (dotted line) of 20 mm HEPES. In the presence of HEPES, the surround response is reduce by 61%. CTR, Control.
Figure 2.
Figure 2.
HEPES attenuates parasol ganglion cell surround. A, Responses of the same ON parasol ganglion cell shown in Figure 1 to an annulus with a 2000-μm-outer diameter and 0-μm-inner diameter (stimulus trace below) square wave stimulus modulated at 2 Hz in the absence (left) and presence (right) of 20 mm HEPES. The response in the presence of HEPES is larger, indicating diminished surround antagonism. B, Responses of a parasol ganglion cell to an annulus with a 2000 μm outer diameter and 450 μm inner diameter (stimulus trace below) square wave modulated at 2 Hz in the absence (left) and presence (right) of 20 mm HEPES. The response in the presence of HEPES is diminished, indicating decreased surround strength. C, Response amplitude as a function of annulus inner diameter (outer diameter is fixed at 2000 μm) in the absence (open circles) and presence (filled circles) of 20 mm HEPES. Stimuli were sinusoidally modulated at 2 Hz. Solid lines are difference of Gaussian receptive field model fits to the data; insets are two-dimensional profiles of the model fits. Responses at small annulus inner diameters are larger and responses at larger annulus inner diameters are smaller in the presence of HEPES, and the ratio of center to surround (cntr/surr) response strength increases. The inset on the right shows the mean response normalized to the maximum amplitude for 10 cells in the absence (solid line) and presence (dotted line) of 20 mm HEPES. In the presence of HEPES, the surround response is reduce by 72%. CTR, Control. D, Response amplitude as a function of spatial frequency in the absence (open circles) and presence (filled circles) of 20 mm HEPES. Stimuli were sinusoidal gratings drifting at 2 Hz. Solid lines are difference of Gaussian receptive field model fits to the data; insets are two-dimensional profiles of the model fits. Responses at small spatial frequencies are larger and responses at larger spatial frequencies are smaller in the presence of HEPES, and the ratio of center to surround response strength increases. The inset on the right shows the mean response normalized to the maximum amplitude for seven cells in the absence (solid line) and presence (dotted line) of 20 mm HEPES. In the presence of HEPES, the surround response is reduced by 75%.
Figure 3.
Figure 3.
Horizontal cell light response. A, Response of a horizontal cell to a 2000 μm spot square wave stimulus modulated at 2 Hz (stimulus trace below). B, Ratio of depolarization amplitude to hyperpolarization amplitude as a function of spot diameter (from 72 to 2000 μm) for a single cell. The slow depolarization increases relative to the hyperpolarization as spot diameter increases. C, Ratio of depolarization to hyperpolarization amplitude (as shown in A) as a function of hyperpolarization amplitude in response to 2000 μm spots (n = 25). The ratio of depolarization to hyperpolarization (Depol./Hyperpol.) is constant across all response amplitudes.
Figure 4.
Figure 4.
HEPES dose response. A, Responses of a horizontal cell to a 2000 μm spot square wave stimulus modulated at 2 Hz (stimulus trace below) for increasing concentrations of HEPES, showing increased hyperpolarizing response amplitude and decreased slow depolarization amplitude. B, Hyperpolarization amplitude as a function of [HEPES]. HEPES increases the hyperpolarization amplitude in a dose-dependent manner (n = 3, 4, or 5) (see Results). C, Ratio of depolarization to hyperpolarization (Depol./Hyperpol.) as a function of [HEPES]. HEPES decreases the depolarization amplitude in a dose dependent manner (n = 3, 4, or 5) (see Results). CTR, Control.
Figure 5.
Figure 5.
HEPES effect on the slope of the H1 response. A, Response of the same horizontal cell shown in Figure 4 to the onset of a 2000 μm spot modulated at 2 Hz. The solid line is the voltage response, and the dotted line is the slope of the response. B, Responses (above) and slope (below) of a horizontal cell to the onset of a 2000 μm spot at 0 (solid), 1 (dashed), 5 (dash and dot), and 20 (dotted) mm HEPES. C, Time of 50% slope crossing relative to control on the downward (filled circles) and upward (open circles) directions (see dotted line in B) as a function of [HEPES] (n = 3, 4, or 5) (see Results). HEPES shifts the upward crossing but not the downward crossing.
Figure 6.
Figure 6.
Other buffers attenuate the slow depolarization. A, Responses of horizontal cells to a 2000 μm spot square wave stimulus modulated at 2 Hz (stimulus trace below) at two concentrations of Tris (above) and MOPS (below). Both Tris and MOPS decrease the depolarization in a dose-dependent manner. B, Ratio of depolarization to hyperpolarization (Depol./Hyperpol.) as a function of buffer capacity for all buffers tested. The effect of all buffers on the depolarization is correlated with their buffering capacity (n = 3, 4, or 5) (see Results). C, Ratio of depolarization to hyperpolarization at 5 mm buffer as a function of buffer pKa. Buffers with pKa values closer to our experimental pH had a stronger effect on the depolarization (n = 3, 4, or 5) (see Results).
Figure 7.
Figure 7.
H1 cell receptive field in the presence of HEPES. A, Horizontal cell response as a function of spot diameter in the absence (solid line) and presence (dashed line) of HEPES. Stimuli were spots sinusoidally modulated at 2 Hz. Response amplitude was measured as the strength of the Fourier component of the membrane voltage at the stimulus frequency, normalized to the maximum amplitude. HEPES causes responses to plateau at larger spot sizes, indicating larger receptive field size (n = 9). CTR, Control. B, Horizontal cell response as a function of annulus inner diameter (outer diameter was fixed at 2000 μm) in the absence (solid line) and presence (dashed line) of 20 mm HEPES. Stimuli and measurement parameters were the same as in A. Responses are stronger at larger annulus inner diameters in the presence of HEPES, indicating larger receptive field size (n = 9).

Similar articles

Cited by

References

    1. Barnes S. Center-surround antagonism mediated by proton Signaling at the cone photoreceptor synapse. J Gen Physiol. 2003;122:653–656. - PMC - PubMed
    1. Barnes S, Bui Q. Modulation of calcium-activated chloride current via pH-induced changes of calcium channel properties in cone photoreceptors. J Neurosci. 1991;11:4015–4023. - PMC - PubMed
    1. Barnes S, Merchant V, Mahmud F. Modulation of transmission gain by protons at the photoreceptor output synapse. Proc Natl Acad Sci USA. 1993;90:10081–10085. - PMC - PubMed
    1. Baylor DA, Fuortes MG, O'Bryan PM. Receptive fields of cones in the retina of the turtle. J Physiol (Lond) 1971;214:265–294. - PMC - PubMed
    1. Baylor D, Nunn BJ, Schnapf JL. Spectral sensitivity of cones of the monkey Macaca fascicularis . J Physiol (Lond) 1987;390:145–160. - PMC - PubMed

Publication types

MeSH terms

LinkOut - more resources