. 2008 Jan 9;28(2):491-504.
doi: 10.1523/JNEUROSCI.1585-07.2008.

Effects of ibotenate and 192IgG-saporin lesions of the nucleus basalis magnocellularis/substantia innominata on spontaneous sleep and wake states and on recovery sleep after sleep deprivation in rats

Affiliations

Effects of ibotenate and 192IgG-saporin lesions of the nucleus basalis magnocellularis/substantia innominata on spontaneous sleep and wake states and on recovery sleep after sleep deprivation in rats

Satvinder Kaur et al. J Neurosci. .

Abstract

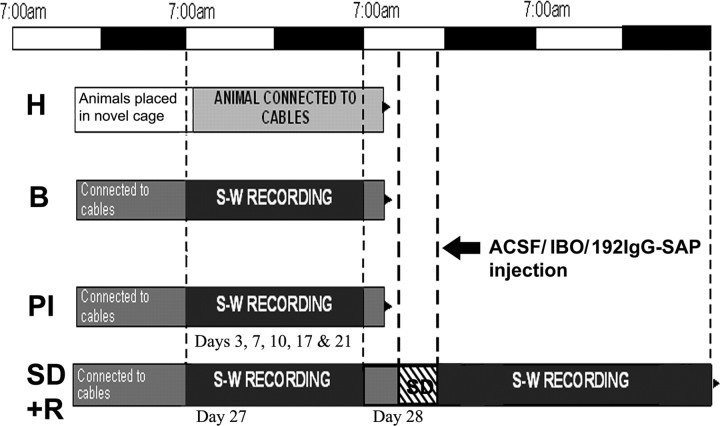
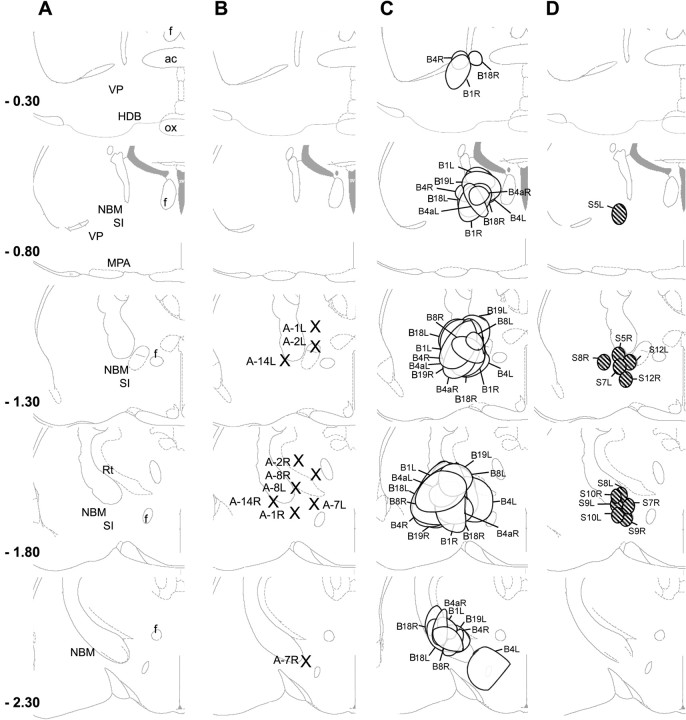
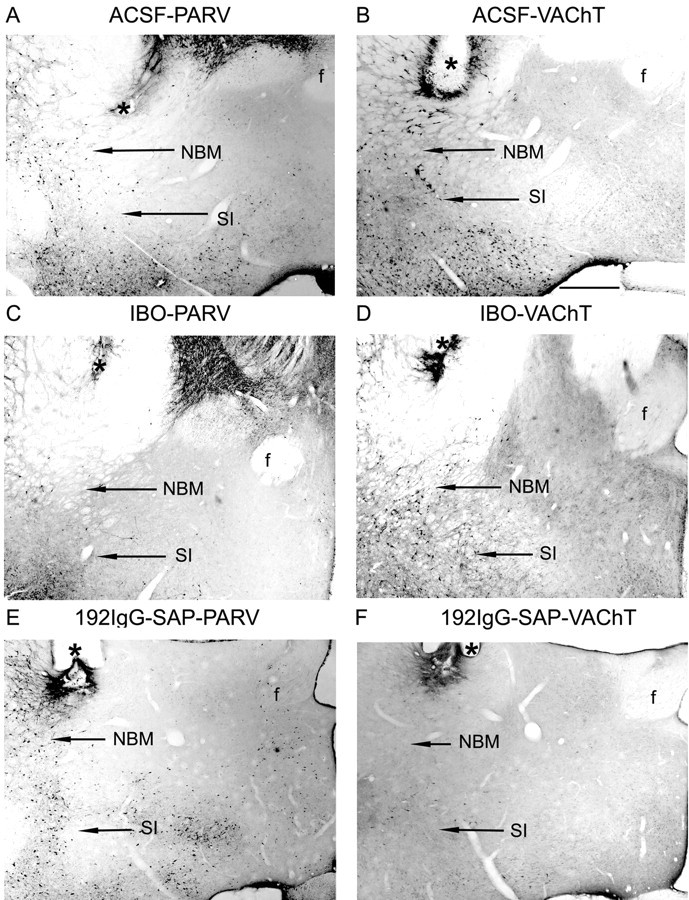
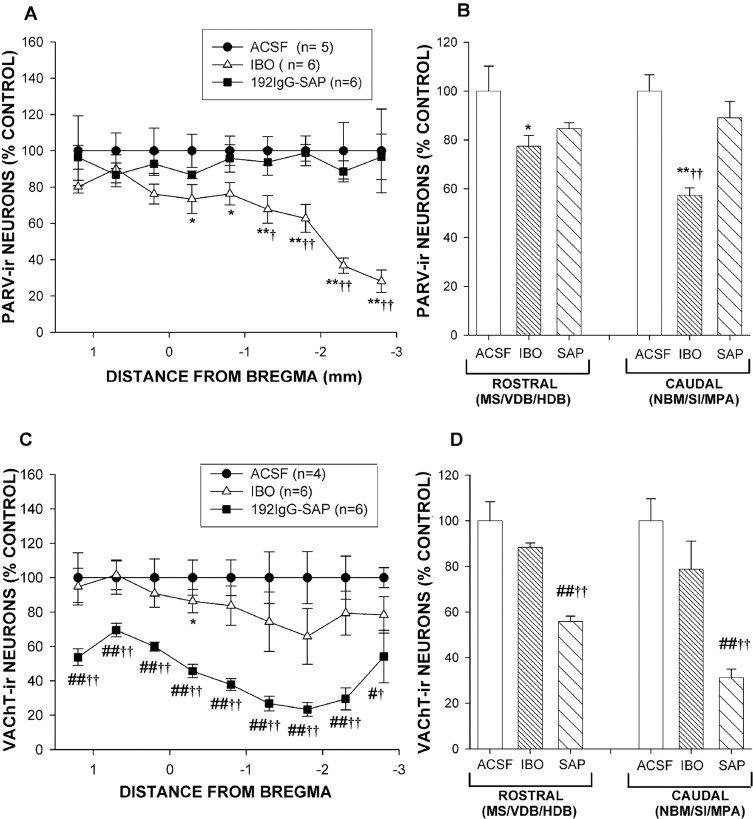
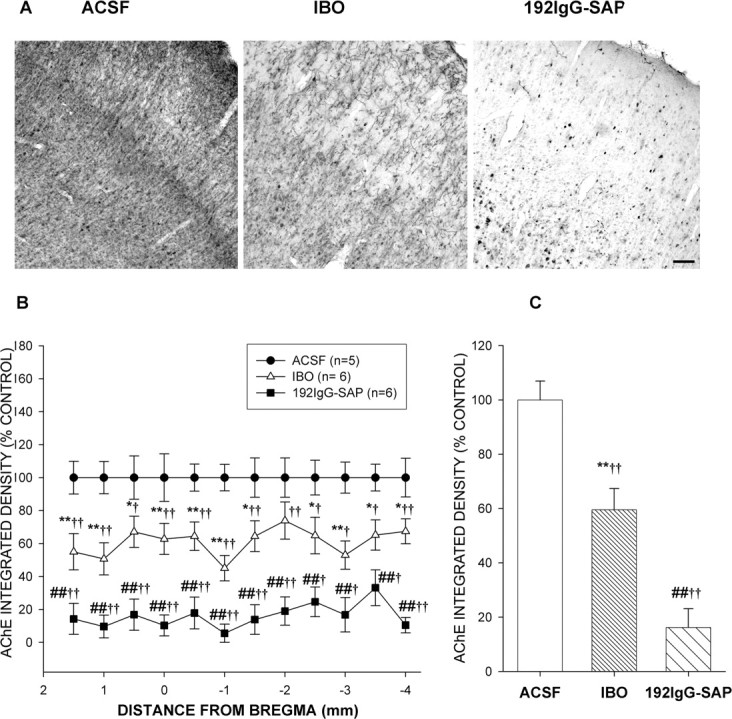
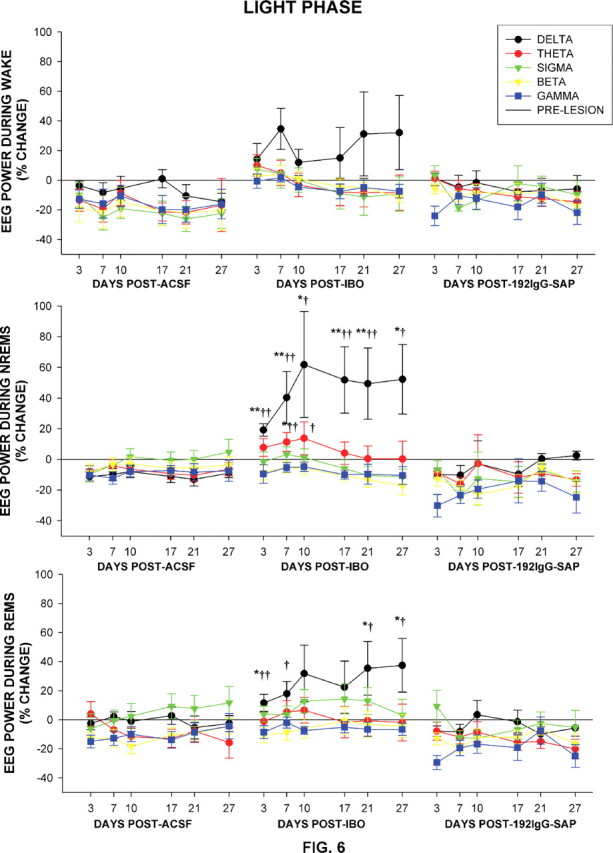
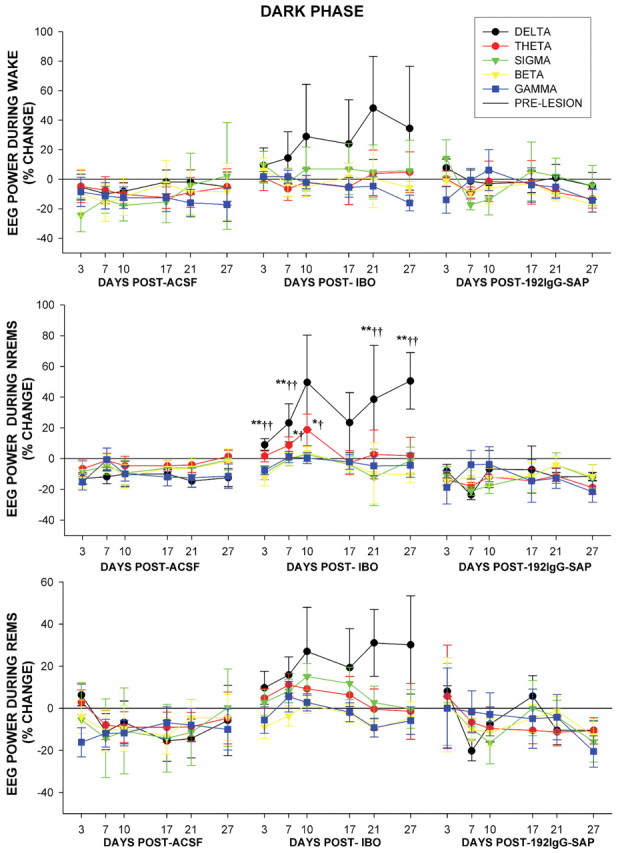
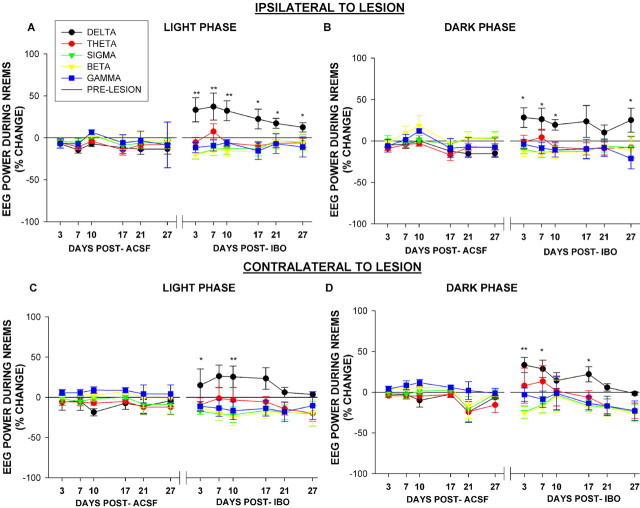
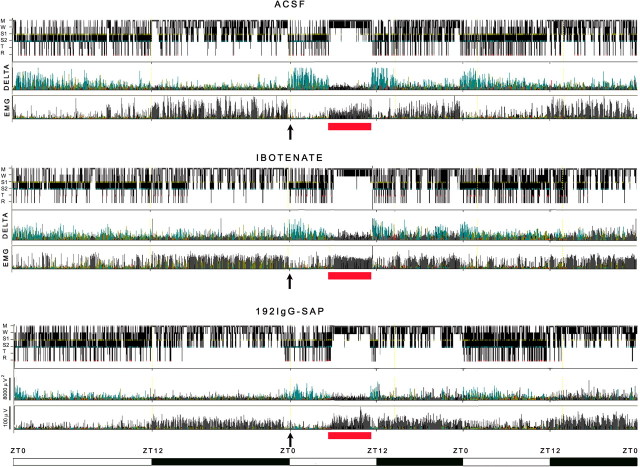
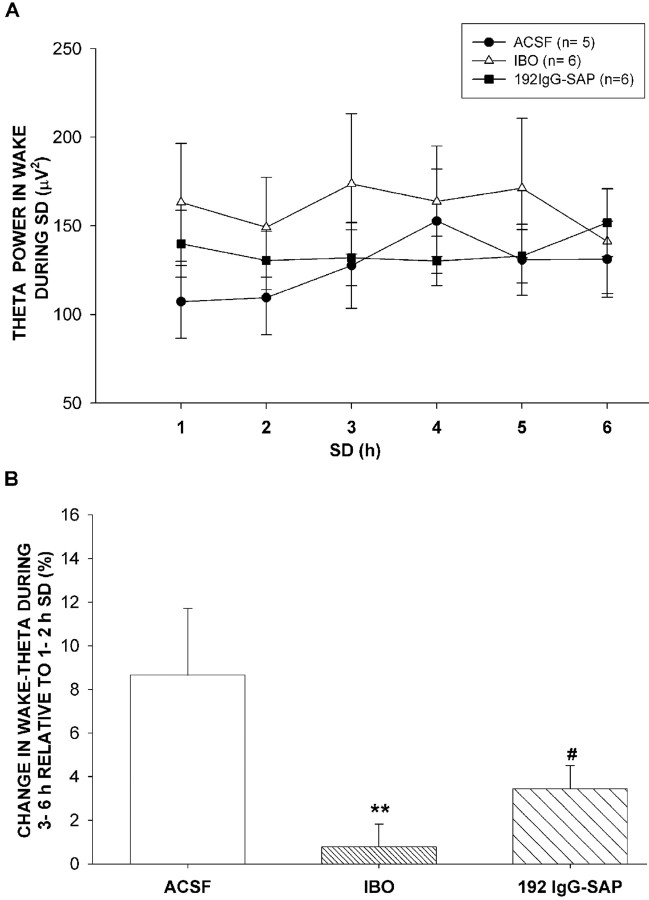
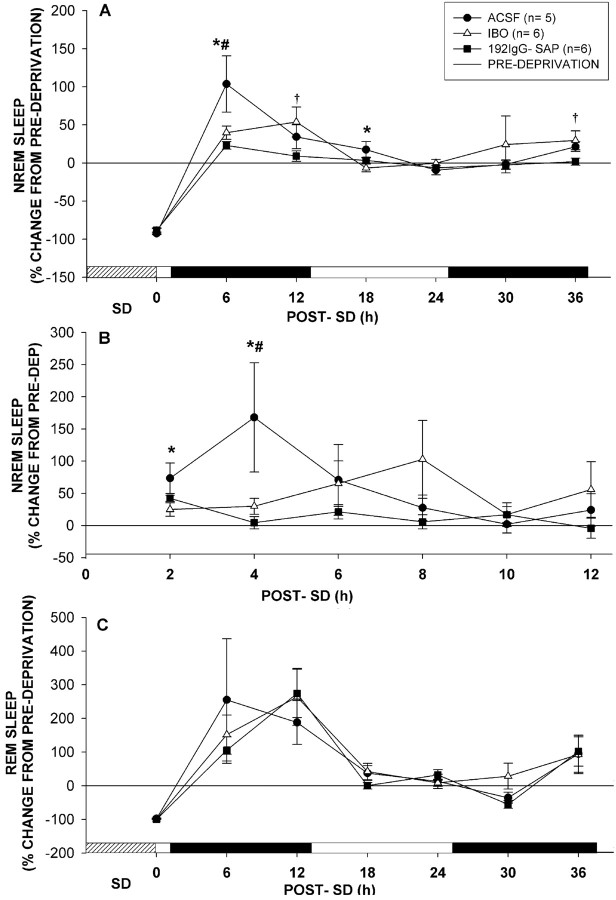
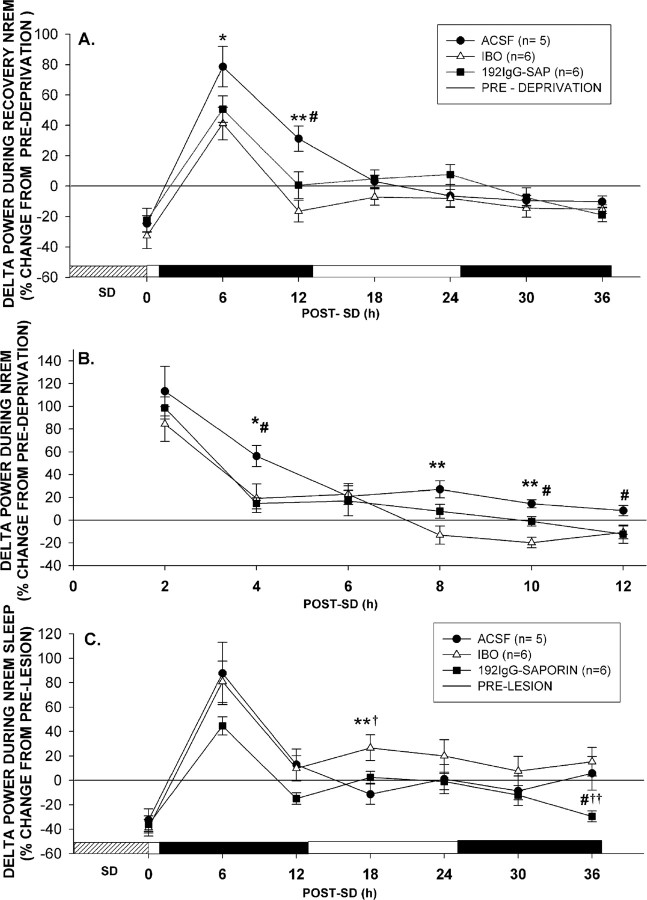
The basal forebrain (BF) is known for its role in cortical and behavioral activation, and has been postulated to have a role in compensatory mechanisms after sleep loss. However, specific neuronal phenotypes responsible for these roles are unclear. We investigated the effects of ibotenate (IBO) and 192IgG-saporin (SAP) lesions of the caudal BF on spontaneous sleep-waking and electroencephalogram (EEG), and recovery sleep and EEG after 6 h of sleep deprivation (SD). Relative to artificial CSF (ACSF) controls, IBO injections decreased parvalbumin and cholinergic neurons in the caudal BF by 43 and 21%, respectively, and cortical acetylcholinesterase staining by 41%. SAP injections nonsignificantly decreased parvalbumin neurons by 11%, but significantly decreased cholinergic neurons by 69% and cortical acetylcholinesterase by 84%. IBO lesions had no effect on sleep-wake states but increased baseline delta power in all states [up to 62% increase during non-rapid eye movement (NREM) sleep]. SAP lesions transiently increased NREM sleep by 13%, predominantly during the dark phase, with no effect on EEG. During the first 12 h after SD, animals with IBO and SAP lesions showed lesser rebound NREM sleep (32 and 77% less, respectively) and delta power (78 and 53% less) relative to ACSF controls. These results suggest that noncholinergic BF neurons promote cortical activation by inhibiting delta waves, whereas cholinergic BF neurons play a nonexclusive role in promoting wake. Intriguingly, these results also suggest that both types of BF neurons play important roles, probably through different mechanisms, in increased NREM sleep and EEG delta power after sleep loss.


Figures

Figure 1.
Figure 1.
The experimental schedule used in the present study. The top row with open and solid bars represents 12:12 light:dark cycles, with lights on at 7:00 A.M. The following rows depict the schedule for habituation (H), preinjection baseline (B), postinjection (PI), SD, and recovery (R) sessions. S–W, Sleep–wake. PI recordings were conducted on days 3, 7, 10, 17, 21, and 27 after ACSF, IBO, or 192IgG-SAP injections. SD was conducted for 6 h by gentle handling. The injections were conducted on the day following the prelesion baseline recording.
Figure 2.
Figure 2.
Location of injection sites. A, The subnuclei of the basal forebrain complex containing magnocellular cholinergic projection neurons at five levels (numbers at the lower left corner indicate distances in millimeters posterior to bregma). B, Sites of injection of artificial CSF (n = 5) determined from Nissl-stained sections. C, Extent of lesions after IBO injections (n = 6) based on loss of neurons and gliosis. Although the extent of lesions was largely confined to the cholinergic cell regions of the basal forebrain, in one case (B4L; IBO lesion), a large lesion on one side (left) extended caudally into the tuberal hypothalamus up to 3 mm posterior to bregma. D, Approximate injection sites with 192IgG-SAP (n = 6) indicated by standardized hatched areas; the size does not reflect the extent of lesion. The numbers adjacent to injection sites or lesion boundaries in B–D represent the case numbers of individual animals, with letters L and R indicating the side of injection or lesion. ac, Anterior commissure; HDB, horizontal limb of the diagonal band of Broca; f, fornix; ox, optic chiasm; MPA, magnocellular preoptic area; Rt, reticular thalamic nucleus; VP, ventral pallidum.
Figure 3.
Figure 3.
Representative micrographic images of coronal sections showing the PARV-immunoreactive (A, C, E) and VAChT-immunoreactive neurons (B, D, F) in the NBM/SI from animals injected with ACSF (A, B), IBO (C, D), or 192IgG-SAP (E, F) into the NBM/SI. A and B, C and D, and E and F for each treatment group are respectively from the same animals. Asterisks indicate the damage caused by guide and/or injector cannula. f, Fornix. Scale bar, 500 μm.
Figure 4.
Figure 4.
Loss of PARV-IR and VAChT-IR BF neurons in animals injected with IBO and 192IgG-SAP compared with those injected with ACSF (control). A, C, The percentage (mean ± SEM) of PARV-IR (A) and VAChT-IR (C) cells in IBO and SAP-injected animals relative to ACSF controls along the rostrocaudal axis of the basal forebrain at 500 μm intervals. The number of PARV-IR and VAChT-IR neurons in ACSF controls ranged from 80 to 380 and 45 to 210, respectively, at each level. See the Results for statistics. B, D, The percentage of PARV-IR (B) and VAChT-IR (D) neurons in the rostral BF [medial septum (MS) and ventral (VDB) and horizontal (HDB) limbs of the diagonal band of Broca] and the caudal BF [NBM, SI, and magnocellular preoptic area (MPA)] after IBO and 192IgG-SAP lesions normalized to ACSF levels. A–D, IBO < ACSF, *p < 0.05, **p < 0.01; SAP < ACSF, #p < 0.05, ##p < 0.01; SAP < IBO, p < 0.05, ††p < 0.01 (see Results for ANOVA).
Figure 5.
Figure 5.
Cholinergic fiber loss after IBO and 192IgG-SAP microinjections into the NBM/SI. A, Representative photomicrographs of AChE-stained sections showing the lateral (somatosensory) cortex from animals injected with ACSF, IBO, or SAP. Note marked depletion of AChE staining after SAP, and moderate depletion after IBO, compared with the ACSF control. Scale bar, 100 μm. B, C, Integrated density of AChE staining (mean ± SEM) in IBO, SAP, and ACSF groups normalized to the ACSF (control) group at different rostrocaudal levels (B) and across all levels (C) of the somatosensory cortex from 2 mm anterior to 4 mm posterior to bregma. B, C, IBO < ACSF, *p < 0.05, **p < 0.01; 192IgG-SAP < ACSF, #p < 0.05, ##p < 0.01; 192IgG-SAP < IBO, p < 0.05, ††p < 0.01 (1-way ANOVA followed by Fisher's PLSD, after significant treatment effect in 2-way ANOVA).
Figure 6.
Figure 6.
Time courses of changes in the EEG power in five frequency ranges in wake, NREM sleep, and REM sleep during the light phase after bilateral ACSF, IBO, or 192IgG-SAP injections into the NBM/SI over a 27 d period after injection. EEG power values are expressed as percentages (mean ± SEM) of the difference from their respective preinjection baselines. EEG frequency ranges: delta, 1–4 Hz; theta, 4.5–8 Hz; sigma, 8.5–13 Hz; beta, 13.5–30 Hz; gamma, 30.5–60 Hz. IBO > ACSF, *p < 0.05, **p < 0.01; IBO >192IgG-SAP, p < 0.05, ††p < 0.01 (1-way ANOVA followed by Fisher's PLSD, after the significance was established in 2-way ANOVA for treatment × time).
Figure 7.
Figure 7.
Time course of changes in the EEG power in wake, NREM sleep, and REM sleep during the dark phase after bilateral ACSF, IBO, or 192IgG-SAP injections into the NBM/SI over a 27 d postinjection period. EEG powers are expressed as percentages (means ± SEM) of preinjection baselines. IBO > ACSF, *p < 0.05, **p < 0.01; IBO >192IgG-SAP, p < 0.05, ††p < 0.01 (1-way ANOVA followed by Fisher's PLSD, after the significance was established in 2-way ANOVA for treatment × time)
Figure 8.
Figure 8.
Time course of changes in the EEG power during NREM sleep state during light and dark phases after unilateral ibotenate injections into the nucleus basalis magnocellularis/substantia innominata. Means ± SEM are expressed relative to prelesion baselines. A, B, Changes in the power of EEG recorded from the cortex ipsilateral to IBO lesion during the light (A) and dark (B) phase. C, D, Changes in the power of EEG recorded from the cortex contralateral to IBO lesion during the light (C) and dark (D) phase. IBO > ACSF, *p < 0.05, **p < 0.01, Mann–Whitney U test for comparison at different time points, after the significant interaction of treatment × day was established with two-way ANOVA.
Figure 9.
Figure 9.
Examples of somnographic and polygraphic recordings from predeprivation (29 h), sleep deprivation (6 h), and postdeprivation (37 h) sessions in three representative animals injected bilaterally with ACSF (control), IBO, or 192IgG-SAP into the nucleus basalis magnocellularis/substantia innominata. The top panel of each window shows a hypnogram representing the time spent in each of 6 sleep–wake states (M, movement or active wake; W, quiet wake; S1, light slow wave sleep; S2, deep slow wave sleep; T, transition to REM sleep; R, REM sleep). The second panel in each window represents the time course of delta (1.0–4.0 Hz) power of the EEG recorded from the left hemisphere, and the third panel shows integrated EMG. The bars at the bottom indicate 12:12 light (open bars):dark (solid bars) cycles; note a change in time scale at the end of the first dark phase (also indicated by arrows at the bottom of each window). The short bar (red) at the bottom of each window denotes the 6 h period of sleep deprivation which ends at ZT 11.
Figure 10.
Figure 10.
Time course of changes in EEG theta power during wake over a 6 h SD period in IBO, 192IgG-SAP and ACSF groups. A, Time course of wake theta value (means ± SEM) during each hour of 6 h of SD in the three treatment groups. Note an increase in theta power in the third hour and thereafter in the ACSF group, and the absence of such increase in the IBO and SAP groups (p = 0.0027 for time × treatment interaction in two-way ANOVA with repeated measures). B, The ratio (mean ± SEM) of the mean change in theta during the last 4 h of deprivation (3–6 h) to the mean during first 2 h (1–2 h). IBO < ACSF, **p < 0.01; 192IgG-SAP < ACSF, #p < 0.05.
Figure 11.
Figure 11.
Time course of recovery NREM and REM sleep time changes after 6 h of SD in the three treatment groups. Means ± SEM are expressed relative to respective predeprivation levels. A, B, The amounts of recovery NREM sleep times in the three treatment groups are represented as differences in percentage (mean ± SEM) from predeprivation baselines in 6 h bins for the period of 36 h post-SD (A) and in 2 h bins for the first 12 h postdeprivation (B). C, The amount of recovery REM sleep time is expressed as percentage (mean ± SEM) of the change from predeprivation baseline in the three treatment groups, and is represented in 6 h bins. Light and dark bars on x-axis represent light and dark phases during the recording period, and the hashed bar represents the 6 h SD period. 192IgG-SAP < ACSF, #p < 0.05; IBO < ACSF, *p < 0.05; 192IgG-SAP < IBO, p < 0.05 (1-way ANOVA followed by Fisher's PLSD, after the significance was established in 2-way ANOVA for treatment × time)
Figure 12.
Figure 12.
Time course of EEG delta power (1–4 Hz) changes during recovery NREM sleep after 6 h of SD. A, B, Delta power values (mean ± SEM) during recovery NREM sleep are expressed in percentages of predeprivation baseline recorded on the 27th postinjection day in 6 h bins during 36 h post-SD (A) and in 2 h bins during the first 12 h post-SD (B). C, Delta power values (mean ± SEM) as expressed as percentages of respective prelesion baselines obtained from the recordings before ACSF, IBO, or SAP injections are shown in 6 h bins across the 36 h recovery period. IBO < ACSF, *p < 0.05, **p < 0.01; 192IgG-SAP < ACSF, #p < 0.05; 192IgG-SAP < IBO, p < 0.05, ††p < 0.001 (1-way ANOVA followed by Fisher's PLSD, after the significance interaction for treatment × time was established in 2-way ANOVA).

Similar articles

Cited by

References

    1. Alam MN, Szymusiak R, Gong H, King J, McGinty D. Adenosinergic modulation of rat basal forebrain neurons during sleep and waking: neuronal recording with microdialysis. J Physiol. 1999;521:679–690. - PMC - PubMed
    1. Arrigoni E, Chamberlin NL, Saper CB, McCarley RW. Adenosine inhibits basal forebrain cholinergic and noncholinergic neurons in vitro. Neuroscience. 2006;140:403–413. - PubMed
    1. Basheer R, Strecker RE, Thakkar MM, McCarley RW. Adenosine and sleep-wake regulation. Prog Neurobiol. 2004;73:379–396. - PubMed
    1. Bassant MH, Apartis E, Jazat-Poindessous FR, Wiley RG, Lamour YA. Selective immunolesion of the basal forebrain cholinergic neurons: effects on hippocampal activity during sleep and wakefulness in the rat. Neurodegeneration. 1995;4:61–70. - PubMed
    1. Berntson GG, Shafi R, Sarter M. Specific contributions of the basal forebrain corticopetal cholinergic system to electroencephalographic activity and sleep/waking behaviour. Eur J Neurosci. 2002;16:2453–2461. - PubMed

Publication types

MeSH terms

LinkOut - more resources