. 2008 Jan 15;105(2):417-21.
doi: 10.1073/pnas.0705349105. Epub 2008 Jan 9.

Noise in solid-state nanopores

Affiliations

Noise in solid-state nanopores

R M M Smeets et al. Proc Natl Acad Sci U S A. .

Abstract

We study ionic current fluctuations in solid-state nanopores over a wide frequency range and present a complete description of the noise characteristics. At low frequencies (f approximately < 100 Hz) we observe 1/f-type of noise. We analyze this low-frequency noise at different salt concentrations and find that the noise power remarkably scales linearly with the inverse number of charge carriers, in agreement with Hooge's relation. We find a Hooge parameter alpha = (1.1 +/- 0.1) x 10(-4). In the high-frequency regime (f approximately > 1 kHz), we can model the increase in current power spectral density with frequency through a calculation of the Johnson noise. Finally, we use these results to compute the signal-to-noise ratio for DNA translocation for different salt concentrations and nanopore diameters, yielding the parameters for optimal detection efficiency.


Conflict of interest statement

The authors declare no conflict of interest.

Figures

Fig. 1.
Fig. 1.
General nanopore characteristics at 1 M salt. (a) Current–voltage characteristics of six individual nanopores with nanopore diameters as indicated. All curves show a linear I–V dependence. (Inset) A transmission electron microscopy image of the 15.6-nm-diameter nanopore. (b) Resistance values of 28 individual nanopores as a function of nanopore diameter. The red line represents the resistance of a 25-nm-long cylinder. Resistance values larger than 2.5 times the resistance indicated by the red line are shown in grey. (c) Current recordings and histograms of two nanopores (at 100 mV) with substantially different resistance values, illustrating clear differences in current noise. The nanopores diameters are 20.8 nm (bottom traces) and 22.0 nm (top traces). The current was filtered at 10 and 1 kHz, as indicated. The black, grey, and blue histograms, shown on the right, are magnified along the x axis to be visible on the same scale. (d) Current power spectral densities of the two nanopores used in c, showing 1/f low-frequency noise of different magnitude and comparable high-frequency noise.
Fig. 2.
Fig. 2.
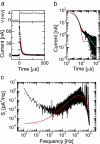
Modeling the high-frequency current noise in nanopores. (a) The applied voltage and the resulting current response as a function of time for a 15.6-nm-diameter nanopore. The red line shows the best fit to the data. (b) The current response of a plotted on logarithmic scales for times up to 104 μs. The red line is identical to the one plotted in a, whereas the cyan line is a fit to Curie's law for t > 40RcCp. (c) Current power spectral density of a 15.6-nm-diameter nanopore (black) and the calculated power spectrum (red solid line). The red dotted line results from an addition of the measured low-frequency noise to the calculated values.
Fig. 3.
Fig. 3.
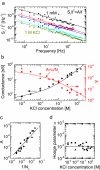
Analysis of low-frequency 1/f noise in nanopores at different salt concentrations. (a) The normalized current power spectral density of an individual nanopore at salt concentrations of 1 mM (black), 10 mM (red), 100 mM (blue), 500 mM (cyan), and 1 M (yellow). The solid lines result from a fit of the data at each salt concentration to the formula shown. (b) Conductance and noise power of three nanopores from salt concentrations of 1 mM up to 1 M. Each individual nanopore has its own symbol. The black line shows the conductance of a cylindrical nanopore with an average nanopore diameter of dpore = 9.3 nm, and a salt-dependent surface charge as given in ref. . The red line shows the noise power in terms of the number of charge carriers using α = 1.1 × 10⁻⁴. (c) Noise power as a function of the calculated inverse number of charge carriers of the data shown in b. The black line indicates the linear scaling. (d) The value of the Hooge parameter over the salt concentration probed for the data shown in b. The Hooge parameter results from the product of the noise power and the number of charge carriers. The black line shows the constant value α = 1.1 × 10⁻⁴.
Fig. 4.
Fig. 4.
SNR calculated for DNA translocation through five nanopores with different diameters as a function of salt concentration. The nanopore diameters are indicated. The smaller the nanopore, the better the SNR. For large nanopores (dpore > 20 nm) measurements performed at low salt concentrations yield the best SNR.

References

    1. Kasianowicz JJ, Brandin E, Branton D, Deamer DW. Characterization of individual polynucleotide molecules using a membrane channel. Proc Natl Acad Sci USA. 1996;93:13770–13773. - PMC - PubMed
    1. Li J, et al. Ion-beam sculpting at nanometre length scales. Nature. 2001;412:166–169. - PubMed
    1. Dekker C. Solid-state nanopores. Nat Nanotechnol. 2007;2:209–215. - PubMed
    1. Chen P, et al. Atomic layer deposition to fine-tune the surface properties and diameters of fabricated nanopores. Nano Lett. 2004;4:1333–1337. - PMC - PubMed
    1. Smeets RMM, et al. Nanobubbles in solid-state nanopores. Phys Rev Lett. 2006;97 088101. - PubMed

Publication types

LinkOut - more resources