. 2008 Mar 15;111(6):3200-10.
doi: 10.1182/blood-2007-10-119099. Epub 2008 Jan 9.

Pathway analysis of primary central nervous system lymphoma

Affiliations

Pathway analysis of primary central nervous system lymphoma

Han W Tun et al. Blood. .

Abstract

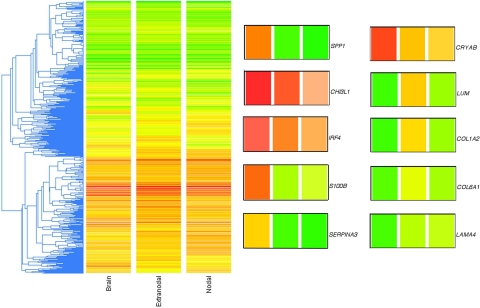
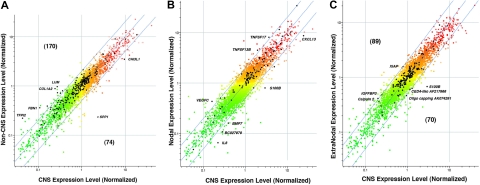
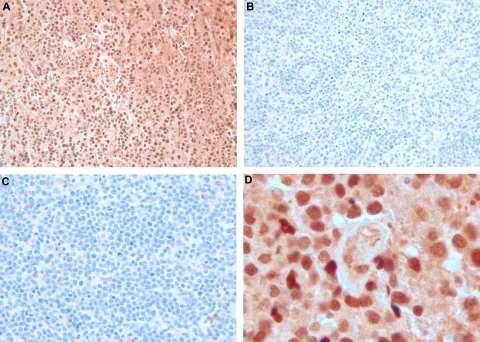
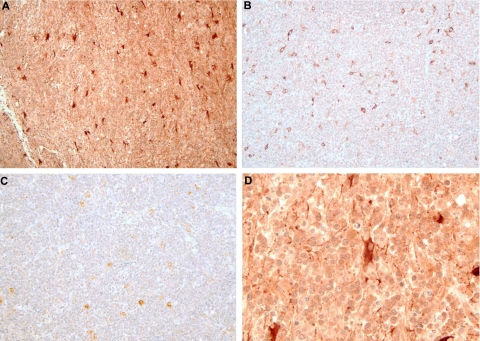
Primary central nervous system (CNS) lymphoma (PCNSL) is a diffuse large B-cell lymphoma (DLBCL) confined to the CNS. A genome-wide gene expression comparison between PCNSL and non-CNS DLBCL was performed, the latter consisting of both nodal and extranodal DLBCL (nDLBCL and enDLBCL), to identify a "CNS signature." Pathway analysis with the program SigPathway revealed that PCNSL is characterized notably by significant differential expression of multiple extracellular matrix (ECM) and adhesion-related pathways. The most significantly up-regulated gene is the ECM-related osteopontin (SPP1). Expression at the protein level of ECM-related SPP1 and CHI3L1 in PCNSL cells was demonstrated by immunohistochemistry. The alterations in gene expression can be interpreted within several biologic contexts with implications for PCNSL, including CNS tropism (ECM and adhesion-related pathways, SPP1, DDR1), B-cell migration (CXCL13, SPP1), activated B-cell subtype (MUM1), lymphoproliferation (SPP1, TCL1A, CHI3L1), aggressive clinical behavior (SPP1, CHI3L1, MUM1), and aggressive metastatic cancer phenotype (SPP1, CHI3L1). The gene expression signature discovered in our study may represent a true "CNS signature" because we contrasted PCNSL with wide-spectrum non-CNS DLBCL on a genomic scale and performed an in-depth bioinformatic analysis.


Figures

Figure 1
Figure 1
Unsupervised clustering of genome-wide expression profiles of PCNSL and non-CNS nodal and extranodal DLBCL. The gene list used was approximately 11 500 in number (genes present on at least 35 of the 43 arrays). The metric used was “standard correlation” in GeneSpring. Because the 2-color array method involved a reference standard, the colors do not represent actual gene expression levels in the tumor samples but rather the ratio of the tumor mRNA to the reference mRNA. The LOWESS method of normalization was used. To the right of the cluster are shown 10 genes of interest enlarged from the cluster; the colored bars correspond to the 3 phenotypes identified at the bottom of the cluster (“Brain,” “Extranodal,” and “Nodal”; left to right). SPP1 (osteopontin), CHI3L1 (chitinase-3 like 1), IRF4 (MUM1), S-100B (S-100 calcium binding protein beta), SERPINA3 (serine proteinase inhibitor, clade A, member 3), CRYAB (crystallin alpha B), LUM (lumican), COL1A2 (collagen type 1 alpha 2), COL6A1 (collagen type 6 alpha 1), and LAMA4 (laminin alpha 4).
Figure 2
Figure 2
Validation of selected genes using quantitative RT-PCR. The blue squares represent CNS/nodal sample ratios; the red inverted triangles are the CNS/extranodal sample ratios. The ratios obtained using quantitative RT-PCR are plotted along the y-axis, whereas the ratios calculated from the microarray data are plotted on the x-axis. The genes analyzed were ATP5J, BCL-6, CD10, CD44, CHI3L1, COX6B1, IRF4, SPP1, TFPI2, and GAPDH. The correlation coefficient shown is that calculated without the non-CNS outlier at the right (CHI3L1 CNS/nodal ratio). The correlation remains significant when including this outlier (R = 0.79; P < .02).
Figure 3
Figure 3
Expression of selected gene sets. (A) Expression of a set of 244 ECM and adhesion-related genes that distinguish PCNSL from non-CNS DLBCL. LOWESS normalization was performed using genes present on at least 35 of the 43 arrays. The colored points are normalized gene ratios for these approximately 11 500 genes, whereas the black points are the ECM and adhesion-related genes. (B) Expression of a set of 92 cytokine genes that distinguish PCNSL and nodal DLBCL. LOWESS normalization was performed using genes present on at least 35 of the 43 arrays. The colored points are normalized gene ratios for these approximately 11 500 genes, whereas the black points are the cytokine-related genes. (C) Expression of a set of 159 apoptosis-related genes that distinguish PCNSL from extranodal DLBCL. LOWESS normalization was performed using genes present on at least 35 of the 43 arrays. The colored points are normalized gene ratios for these approximately 11 500 genes, whereas the black points are the apoptosis-related genes. The range of colors in these panels reflects range of gene levels in the CNS phenotype in panel A, or the Nodal and Extranodal phenotype in panels B and C, respectively. Specifically, the gene level refers to the ratio formed by dividing the gene level in the tumor by the level of the universal reference. Red indicates levels more than 1.0, whereas green indicates fractions less than 1.0.
Figure 4
Figure 4
Clustering results using FDA genes separating 2 classes: CNS versus non-CNS. The left-hand plot shows the complete tree, whereas 4 regions within the tree are shown at right. Shades of red indicate ratios more than 1.0; shades of green indicate ratios less than 1.0; black indicates a ratio of 1.0.
Figure 5
Figure 5
Osteopontin immunohistochemistry in DLBCL. The immunoperoxidase complexes were visualized with diaminobenzidine (brown), and the sections were counterstained with hematoxylin. (A) PCNSL: original magnification ×200. Nearly every tumor cell of this brain biopsy is immunoreactive. (B) Nodal DLBCL: original magnification ×200. Essentially no tumor cell contains immunoreactivity. (C) Extranodal DLBCL (skin): original magnification ×200. Essentially no tumor cell contains immunoreactivity. (D) PCNSL: original magnification ×1000 oil. Cross section of a small vessel, probably a vein, surrounded by osteopontin-positive tumor cells.
Figure 6
Figure 6
Chitinase-3-like 1 immunohistochemistry in DLBCL. The immunoperoxidase complexes were visualized with diaminobenzidine (brown), and the sections were counterstained with hematoxylin. (A) PCNSL: original magnification ×200. Most tumor cells express moderate levels of CHI3L1 with a minority expressing strong levels. The largest profiles with heavy immunoreactivity are possibly astrocytes (see also panel D). (B) Nodal DLBCL: original magnification ×200. Most of the tumor cells contain low levels of immunoreactivity. The larger, strongly positive cells may be macrophages. (C) Extranodal DLBCL (spleen): original magnification ×200. (D) PCNSL: original magnification ×400. This is a higher power view of the PCNSL shown in panel A, showing astrocyte-like profiles with moderate to strong levels of immunoreactivity.

Comment in

Similar articles

Cited by

References

    1. Anthony IC, Crawford DH, Bell JE. B lymphocytes in the normal brain: contrasts with HIV-associated lymphoid infiltrates and lymphomas. Brain. 2003;126:1058–1067. - PubMed
    1. Braaten KM, Betensky RA, de Leval L, et al. BCL-6 expression predicts improved survival in patients with primary central nervous system lymphoma. Clin Cancer Res. 2003;9:1063–1069. - PubMed
    1. Larocca LM, Capello D, Rinelli A, et al. The molecular and phenotypic profile of primary central nervous system lymphoma identifies distinct categories of the disease and is consistent with histogenetic derivation from germinal center-related B cells. Blood. 1998;92:1011–1019. - PubMed
    1. Rosenwald A, Wright G, Chan WC, et al. The use of molecular profiling to predict survival after chemotherapy for diffuse large-B-cell lymphoma. N Engl J Med. 2002;346:1937–1947. - PubMed
    1. Camilleri-Broet S, Criniere E, Broet P, et al. A uniform activated B-cell-like immunophenotype might explain the poor prognosis of primary central nervous system lymphomas: analysis of 83 cases. Blood. 2006;107:190–196. - PubMed

Publication types

MeSH terms