. 2008 Jul;128(7):1812-20.
doi: 10.1038/sj.jid.5701223. Epub 2008 Jan 10.

Dynamics of neutrophil infiltration during cutaneous wound healing and infection using fluorescence imaging

Affiliations

Dynamics of neutrophil infiltration during cutaneous wound healing and infection using fluorescence imaging

Min-Ho Kim et al. J Invest Dermatol. 2008 Jul.

Abstract

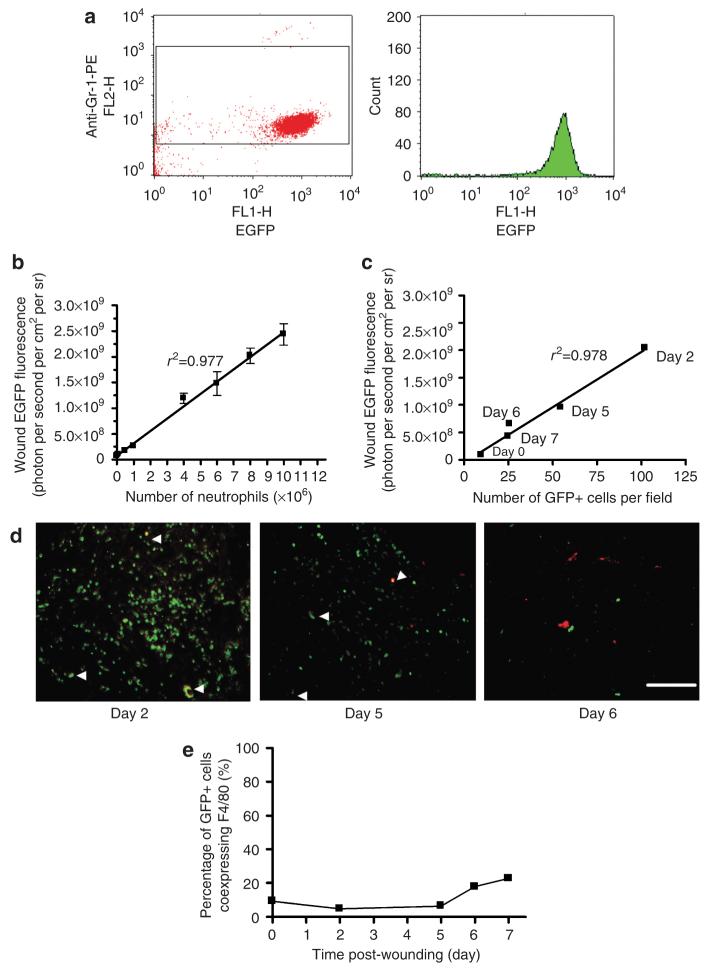
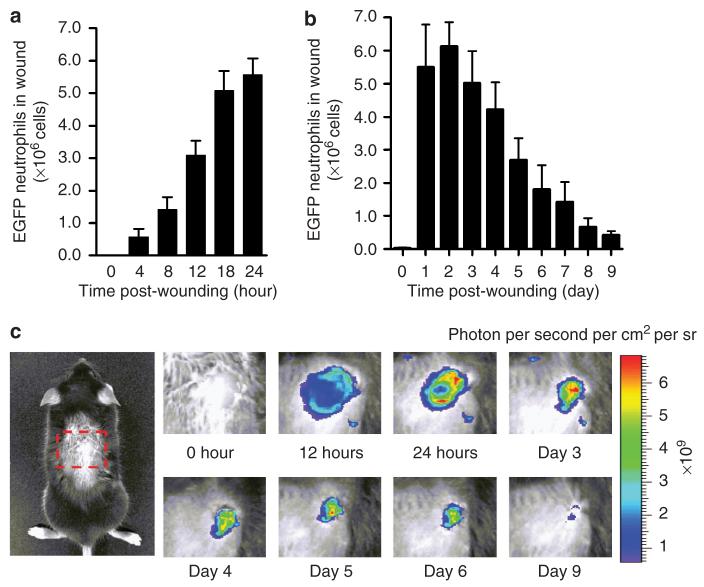
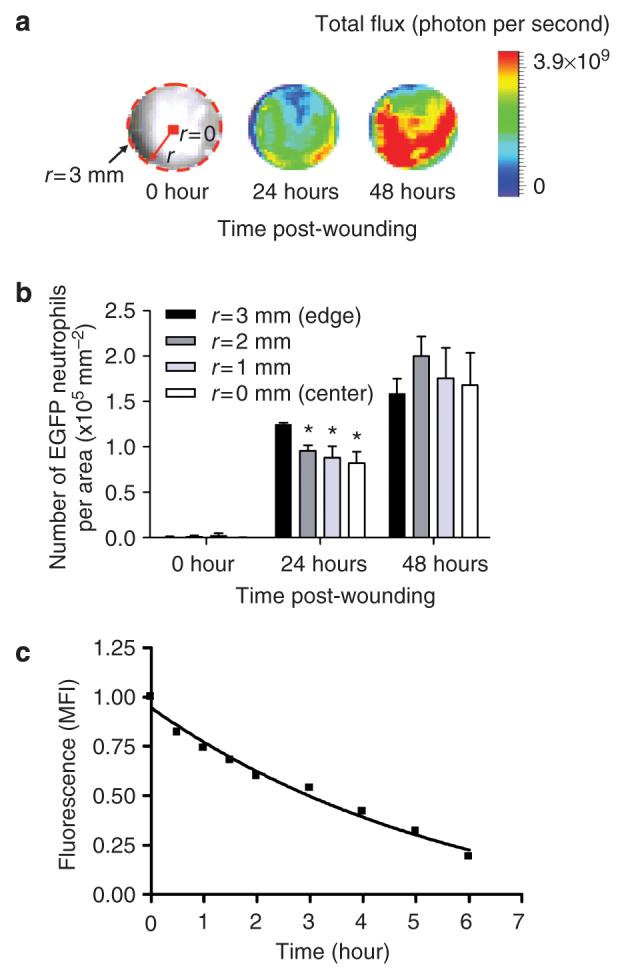
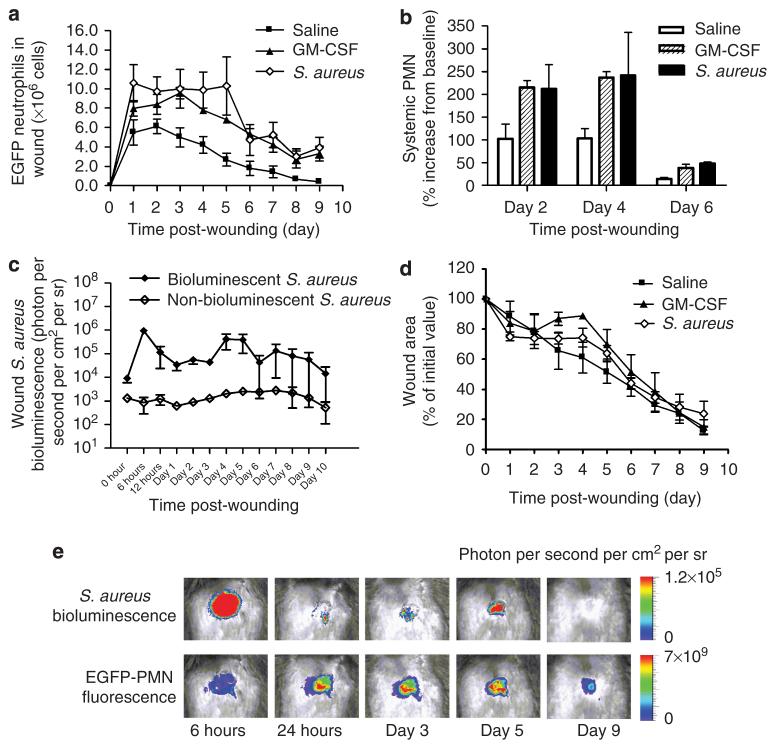
Neutrophil influx is an early inflammatory response that is essential for the clearance of bacteria and cellular debris during cutaneous wounding. A non-invasive real-time fluorescence imaging technique was developed to examine the kinetics of enhanced green fluorescence protein-polymorphonuclear leukocyte (EGFP-PMN) influx within a wound. We hypothesized that infection or systemic availability would directly regulate the dynamics of EGFP-PMN recruitment and the efficiency of wound closure. Neutrophil recruitment increased dramatically over the first 24 hours from 10(6) at 4 hours up to a maximum of 5 x 10(6) EGFP-PMNs at 18 hours. A high rate of EGFP-PMN turnover was evidenced by approximately 80% decrease in EGFP signal within 6 hours. In response to wound colonization by Staphylococcus aureus or injection of GM-CSF, systemic PMNs increased twofold above saline control. This correlated with an increase in EGFP-PMN recruitment up to approximately 10(7) within the wound. Despite this effect by these distinct inflammatory drivers, wound closure occurred at a rate similar to the saline-treated control group. In summary, a non-invasive fluorescence-based imaging approach combined with genetic labeling of neutrophils provides a dynamic inner view of inflammation and the kinetics of neutrophil infiltration into the wounded skin over extended durations.


Figures

Figure 1
Figure 1. Tissue fluorescence intensity correlates with EGFP-PMN recruitment into the wound area
(a) Flow cytometric detection of bone marrow-isolated neutrophils (Gr-1-positive cells) expressing EGFP fluorescence. Left panel is an EGFP/anti-Gr-1-PE plot and right panel is a cell count histogram showing EGFP+ cells, in which Gr-1+ cells were gated to determine the percentage of EGFP+ cells from total Gr-1+ cells. Representatives of two separate experiments. (b) In vivo titration of bone marrow-isolated neutrophils. GFP fluorescent intensity correlates linearly with number of EGFP neutrophils placed in back skin wound site of wild-type mice (n=2, fluorescence intensity=241*PMN+7.57×10⁷). Data are expressed as mean±SEM. (c) GFP fluorescence intensity correlates linearly with number of GFP+ cells in histological skin sections of wounded site viewed by fluorescence microscopy, in which counted GFP+ cells in histological sections of skin at days 0, 2, 5, 6, and 7 after wounding were correlated with GFP fluorescence intensity measured using Xenogen imaging system just before the preparation of histological skin sections. (d) Immunofluorescent detection of macrophages (F4/80+ cells, red) expressing EGFP fluorescence in histological sections of skin at days 0, 2, 5, 6, and 7 after wounding. White arrow indicates EGFP+ cells coexpressing F4/80 (shown as yellow). Bar=100 μm. (e) Percentage of GFP+ monocyte/macrophage coexpressing F4/80 total GFP+ cells. Either GFP+ or F4/80+ cells was counted from 5 to 6 different regions of each samples and average was taken for mean value.
Figure 2
Figure 2. Dynamics of neutrophil infiltration over time course of wound healing
(a) Time course of wound EGFP fluorescence during initial 24 hours after wounding (n=4). (b) Time course of wound EGFP fluorescence during initial 10 days after wounding (n=5). (c) Representative fluorescent images of EGFP neutrophil infiltration during entire wound healing process. Data were expressed as means±SEM.
Figure 3
Figure 3. Spatial mapping and lifetime of EGFP-PMN in the wound
(a) Representative fluorescent image of GFP intensity (photon per second per cm2 per sr) emitted from infiltrated EGFP-PMN in circular (3 mm in radius) full thickness wound at 0, 24, and 48 hours after wounding. Where r and dotted line indicate radius and boundary of wound edge, respectively. (b) Dynamic changes in number of EGFP-PMN per area at regions from edge (r=3 mm) to center (r=0) within wound area at 0, 24, and 48 hours after wounding (n=3). *Significant difference between r=3 vs r=2, r=1, and r=0mm (P<0.05). (c) Ex vivo time-dependent decay of GFP fluorescence emitted from bone marrow-isolated EGFP-PMN (1×10⁶ cells) on back skin wound of WT mice. Fluorescence intensity in the presence of EGFP-PMN was normalized to the value before application (normalized fluorescence intensity=1.136 exp(-0.17t)-0.1892). Data are expressed as mean±SEM.
Figure 4
Figure 4. GM-CSF and S. aureus inoculation increase systemic neutrophil count and wound recruitment, but not wound healing time
(a) Dynamics of neutrophil infiltration over time course of wound healing for saline-injected control (n=5), GM-CSF (n=5), and S. aureus(n=4) groups. (b) Percentage increase of circulating neutrophil numbers from basal value at day 0 (baseline value: 0.28±0.08×10⁶PMN ml-1 for saline control, 0.21±0.01×10⁶PMN ml-1 for GM-CSF, and 0.15±0.15×=106PMN ml-1 for S. aureus group). (c) Dynamics of in vivo bioluminescence of actively metabolizing bacteria in wounded skin of EGFP mice inoculated with bioluminescent and non-bioluminescent strain of S. aureus.(d) Wound area over time course of wound healing for saline-injected control (n=5), GM-CSF (n=4), and S. aureus (n= 4) groups. (e) Representative images of in vivo S. aureus bioluminescence and EGFP neutrophil fluorescence. Data are expressed as mean±SEM.

Similar articles

Cited by

References

    1. Agaiby AD, Dyson M. Immuno-inflammatory cell dynamics during cutaneous wound healing. J Anat. 1999;195(Part 4):531–42. - PMC - PubMed
    1. Baskaran H, Yarmush ML, Berthiaume F. Dynamics of tissue neutrophil sequestration after cutaneous burns in rats. J Surg Res. 2000;93:88–96. - PubMed
    1. Bengtson SH, Phagoo SB, Norrby-Teglund A, Pahlman L, Morgelin M, Zuraw BL, et al. Kinin receptor expression during Staphylococcus aureus infection. Blood. 2006;108:2055–63. - PMC - PubMed
    1. Cianfarani F, Tommasi R, Failla CM, Viviano MT, Annessi G, Papi M, et al. Granulocyte/macrophage colony-stimulating factor treatment of human chronic ulcers promotes angiogenesis associated with de novo vascular endothelial growth factor transcription in the ulcer bed. Br J Dermatol. 2006;154:34–41. - PubMed
    1. Coxon A, Tang T, Mayadas TN. Cytokine-activated endothelial cells delay neutrophil apoptosis in vitro and in vivo. A role for granulocyte/macrophage colony-stimulating factor. J Exp Med. 1999;190:923–34. - PMC - PubMed

Publication types

Substances

LinkOut - more resources