. 2008 Jan 10;451(7175):197-201.
doi: 10.1038/nature06476.

Ultra-fine frequency tuning revealed in single neurons of human auditory cortex

Affiliations

Ultra-fine frequency tuning revealed in single neurons of human auditory cortex

Y Bitterman et al. Nature. .

Abstract

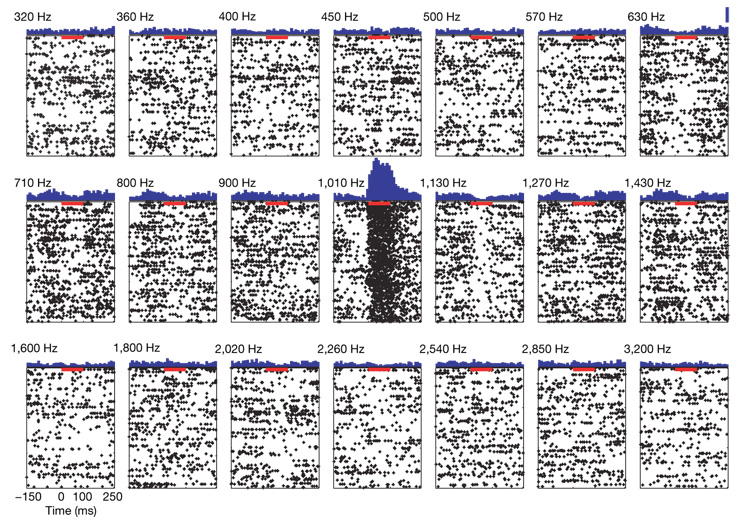
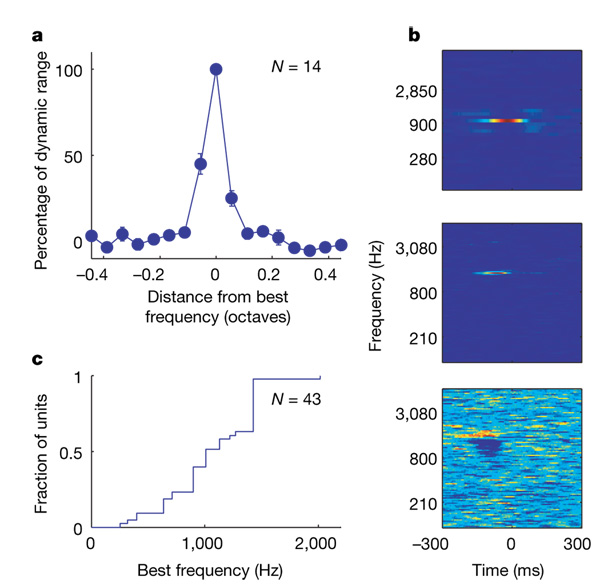
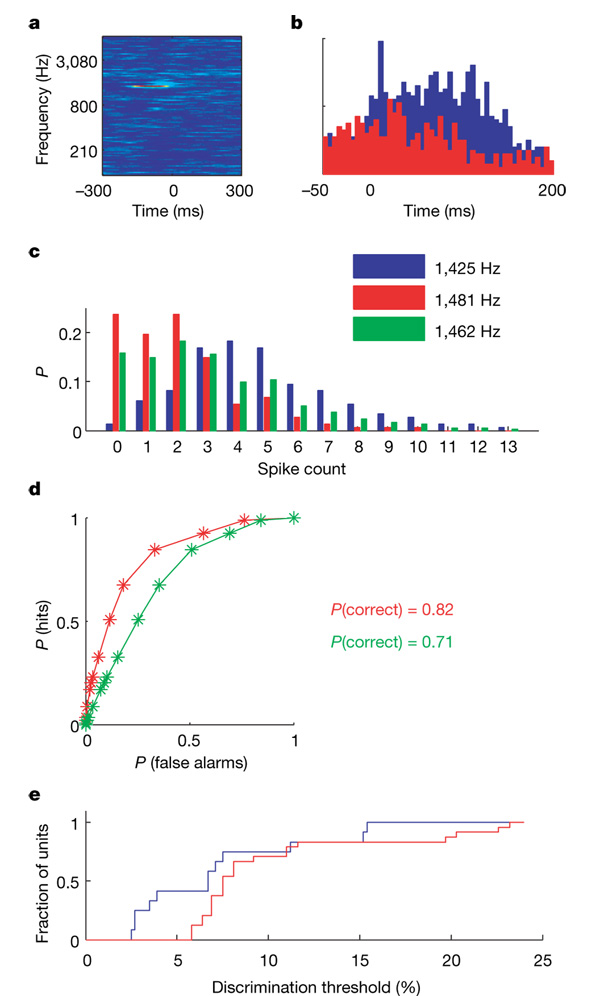
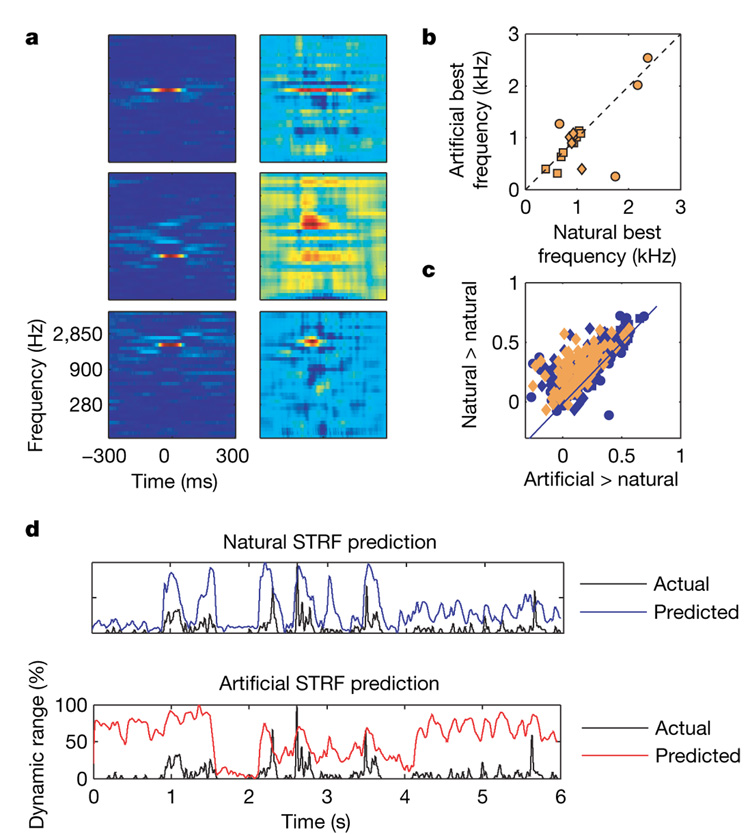
Just-noticeable differences of physical parameters are often limited by the resolution of the peripheral sensory apparatus. Thus, two-point discrimination in vision is limited by the size of individual photoreceptors. Frequency selectivity is a basic property of neurons in the mammalian auditory pathway. However, just-noticeable differences of frequency are substantially smaller than the bandwidth of the peripheral sensors. Here we report that frequency tuning in single neurons recorded from human auditory cortex in response to random-chord stimuli is far narrower than that typically described in any other mammalian species (besides bats), and substantially exceeds that attributed to the human auditory periphery. Interestingly, simple spectral filter models failed to predict the neuronal responses to natural stimuli, including speech and music. Thus, natural sounds engage additional processing mechanisms beyond the exquisite frequency tuning probed by the random-chord stimuli.


Figures

Figure 1
Figure 1. Response selectivity
Raster plots of responses of one unit to chords containing the frequency specified above each panel (270 repetitions in each panel) and peristimulus time histograms (PSTH, blue; bin width 10 ms) based on these raster plots (the scale line at the top right PSTH corresponds to a firing rate of 16 spikes per second; maximum firing rate at, preferred frequency: 47 spikes per second). Red bars mark 100 ms (duration of one chord) from the beginning of the response to the preferred frequency. The frequency table contained 20 additional frequencies (below 320 Hz and above 3,200 Hz); no other frequency elicited significant responses.
Figure 2
Figure 2. Frequency tuning in the responses to the random-chord stimulus
a, Mean tuning curve (see Methods). Error bars indicate s.e.m. b, STRFs of three units estimated from the responses to the random-chord stimulus. The top panel shows a unit tested with six-tones-per-octave resolution that responded to a single frequency (colour scale saturation: 2.5–39 spikes per second). The middle panel shows a unit tested with 18-tones-per-octave resolution that responded predominantly to a single frequency (colour scale saturation: 1–32 spikes per second). The bottom panel shows a unit with complex tuning (colour scale saturation: 0–3.4 spikes per second). c, Cumulative distribution of the best frequencies of 43 units with a clear excitatory peak.
Figure 3
Figure 3. Frequency discrimination based on single-trial responses
a, STRF of an excitatory unit estimated from the responses to the high-resolution random-chord stimulus (colour scale saturation: 6–36 spikes per second).b, PSTHs (bin width: 5 ms); blue is the response to the best frequency and red is the response to the adjacent frequency. The ordinate represents firing rate, scale: 0–40 spikes per second. c, Empirical spike count distributions of best-frequency responses (blue), of the responses to the adjacent frequency (red) and an estimated distribution of responses to an intermediate frequency (green). The ordinate represents the probability P of observing each spike count. d, ROC curves generated from pairs of distributions in c. Red: 1,425 and 1,481 Hz (interval: 3.9%). Green: 1,425 and 1,461 Hz (interval: 2.5%). e, Cumulative distribution of just-noticeable differences for units tested with random-chord stimuli at six tones per octave (red, N = 27) and 18 tones per octave (blue, N = 15).
Figure 4
Figure 4. Natural versus artificial responses
a, STRFs of three units based on responses to the random-chord stimulus (left) and to the soundtrack (right). b, Best frequency of artificial STRFs versus best frequency of natural STRFs (N =16). c, Correlations between predictions and actual responses to one-minute segments from the soundtrack. Abscissa: using artificial STRFs (orange, 14 units) or synthetic STRFs (blue, 31 units). Ordinate: using natural STRFs. d, Predictions and response to one minute of the soundtrack by natural (top) and artificial (bottom) STRFs: 121 ms hamming window. Correlation coefficients are 0.46 and 0.18, respectively.

Comment in

References

    1. Howard MA, III, et al. A chronic microelectrode investigation of the tonotopic organization of human auditory cortex. Brain Res. 1996;724:260–264. - PubMed
    1. Nelken I. In: Integrative Functions in the Mammalian Auditory Pathway. Oertel D, Popper AN, Fay RR, editors. New York: Springer; 2002. pp. 358–416.
    1. Moore BCJ. An Introduction to the Psychology of Hearing Ch. Vol. 3. London: Academic Press; 1982. pp. 74–114.
    1. Evans EF. In: Psychophysics and Physiology of Hearing. Evans EF, Wilson JP, editors. London: Academic Press; 1977. pp. 185–196.
    1. Ehret G, Schreiner CE. Frequency resolution and spectral integration (critical band analysis) in single units of the cat primary auditory cortex. J. Comp. Physiol. A. 1997;181:635–650. - PubMed

Publication types