Comparative Study
. 2008 Jun;26(6):824-33.
doi: 10.1002/jor.20531.

Adhesions in a murine flexor tendon graft model: autograft versus allograft reconstruction

Affiliations
Comparative Study

Adhesions in a murine flexor tendon graft model: autograft versus allograft reconstruction

Sys Hasslund et al. J Orthop Res. 2008 Jun.

Abstract

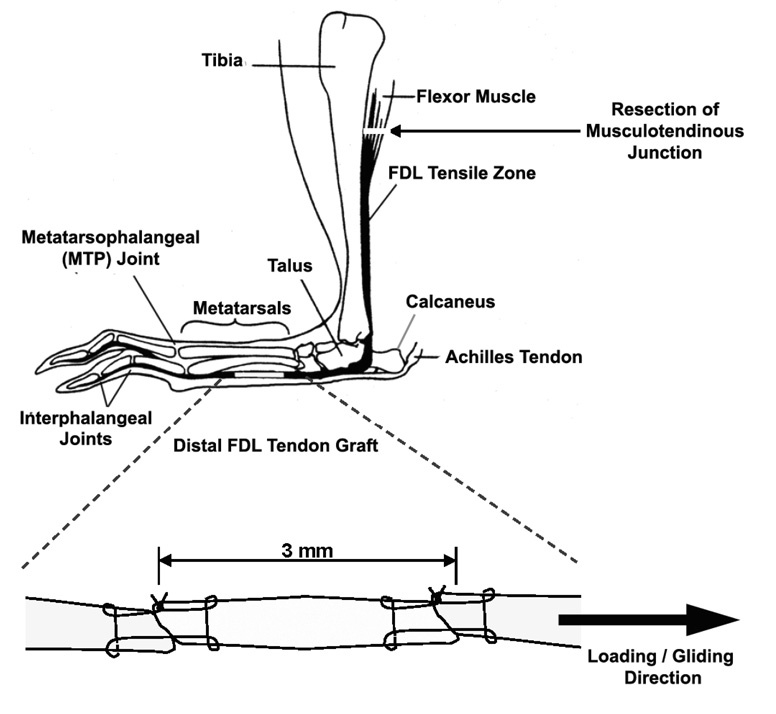
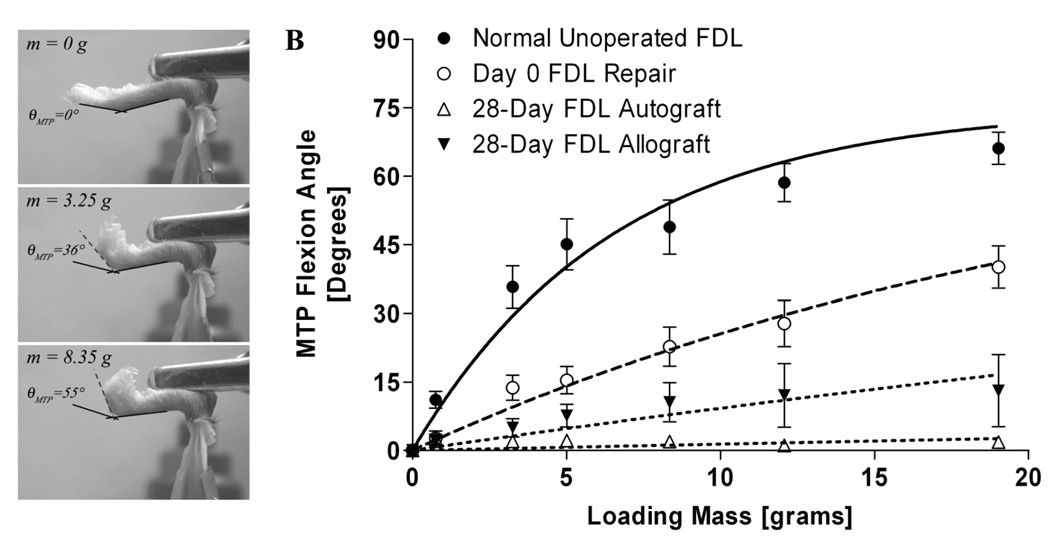
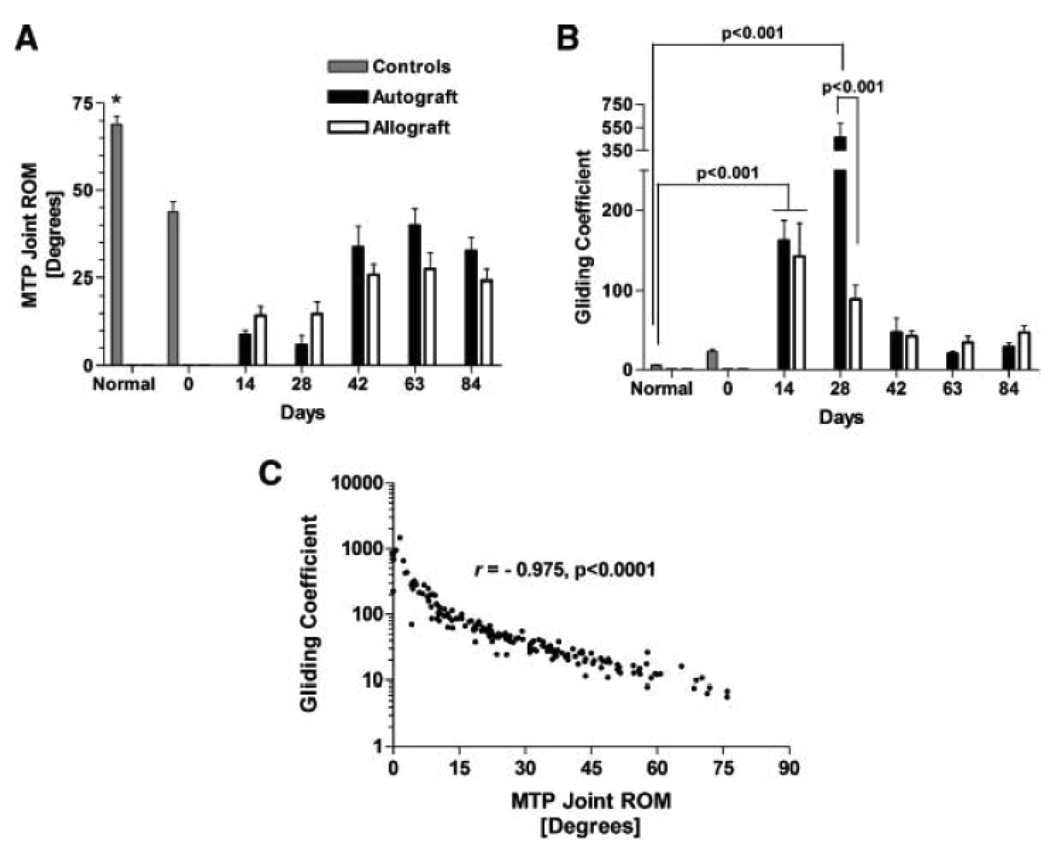
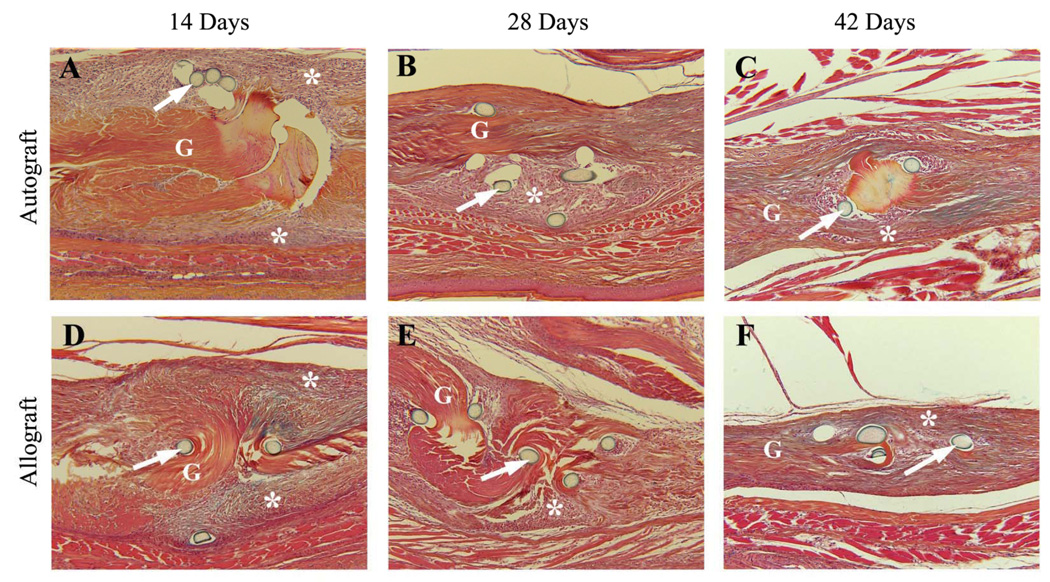
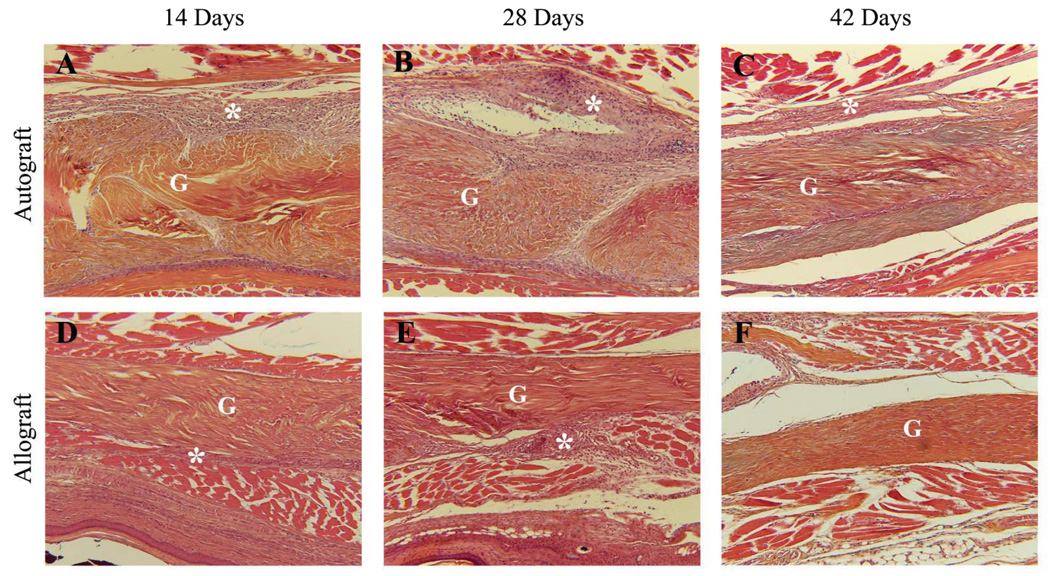
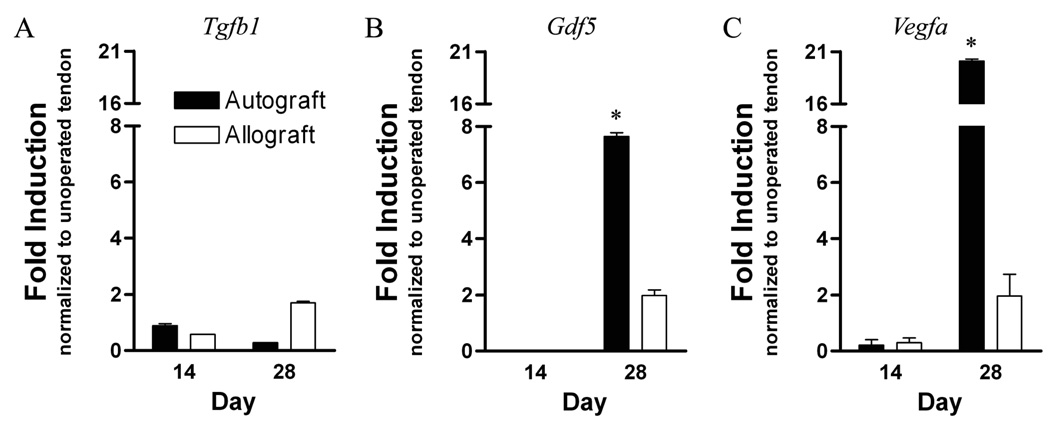
Reconstruction of flexor tendons often results in adhesions that compromise joint flexion. Little is known about the factors involved in the formation of flexor tendon graft adhesions. In this study, we developed and characterized a novel mouse model of flexor digitorum longus (FDL) tendon reconstruction with live autografts or reconstituted freeze-dried allografts. Grafted tendons were evaluated at multiple time points up to 84 days post-reconstruction. To assess the flexion range of the metatarsophalangeal joint, we developed a quantitative outcome measure proportional to the resistance to tendon gliding due to adhesions, which we termed the Gliding Coefficient. At 14 days post-grafting, the Gliding Coefficient was 29- and 26-fold greater than normal FDL tendon for both autografts and allografts, respectively (p < 0.001), and subsequently doubled for 28-day autografts. Interestingly, there were no significant differences in maximum tensile force or stiffness between live autograft and freeze-dried allograft repairs over time. Histologically, autograft healing was characterized by extensive remodeling and exuberant scarring around both the ends and the body of the graft, whereas allograft scarring was abundant only near the graft-host junctions. Gene expression of GDF-5 and VEGF were significantly increased in 28-day autografts compared to allografts and to normal tendons. These results suggest that the biomechanical advantages for tendon reconstruction using live autografts over devitalized allografts are minimal. This mouse model can be useful in elucidating the molecular mechanisms in tendon repair and can aid in preliminary screening of molecular treatments of flexor tendon adhesions.


Figures

Figure 1
Figure 1
A schematic illustration of the live autograft or freeze-dried allograft reconstruction of the murine distal FDL tendon. The tendon is transected at the proximal musculotendinous junction to temporarily immobilize the flexor mechanism to protect against the disruption of the tendon graft and to stimulate adhesions.
Figure 2
Figure 2
(A) Assessment of MTP joint flexion upon FDL tendon loading. The lower hind limb of the mouse was disarticulated from the knee, and the proximal FDL tendon was isolated and loaded incrementally using dead weights in the direction of the anatomical pull starting with a neutral unloaded position. At each load a digital picture was taken. Subsequently the MTP flexion angle was measured relative to the unloaded position. (B) Representative flexion curves (flexion angles versus applied loads) of the MTP joint in normal (unoperated) and grafted FDL tendons (days 0 and 28 post grafting). Discrete data points represent measured flexion angles (mean ± SEM). Lines represent best fit curves based on modeling the data using the single-phase exponential association equation MTP Flexion Angle = β × [1 − exp(−m/α)], where m is the applied mass, β is the maximum flexion angle (75° for normal unoperated FDL tendons), and α is the Gliding Coefficient.
Figure 3
Figure 3
Effects of freeze-drying on the mouse FDL tendon tensile biomechanical properties. FDL tendons were harvested from cadaver mice and tested biomechanically either immediately without freezing (Fresh), after a single −20°C freeze-thaw cycle (Fresh-Frozen), after being freeze-dried and reconstituted in PBS once (1× Freeze-Dried), or after being freeze-dried and reconstituted in PBS twice (2× Freeze-Dried). Data presented as mean ± SEM.
Figure 4
Figure 4
(A) MTP joint flexion ROM and (B) Gliding Coefficients of normal unoperated FDL tendons and FDL tendon autografts and allografts at multiple time points post-grafting (mean ± SEM). Asterisk indicates significant difference between normal and operated tendons (p<0.001). (C) Correlation between the empirically determined Gliding Coefficient and the MTP range of flexion (Spearman’s r = −0.975, p<0.0001).
Figure 5
Figure 5
Representative histologic sections of the proximal host-graft junction of the FDL tendon autografts (A–C) and allografts (D–F) at 14, 28, and 42 days post surgery. Sections were stained with Orange G/Alcian Blue (10X). Of note is that both 14-day and 28-day autograft (A & B) and allograft (D & E) ends adjacent to the suture (arrows) are surrounded by similar amounts of hyper-cellular fibrotic scar tissue (*) and appear enlarged relative to the body of the graft proper (marked as G). By day 42, the amount of scarring and the enlargement at the graft-host junction are reduced for both autografts (C) and allografts (F).
Figure 6
Figure 6
Representative histologic sections of the middle segment of the FDL tendon autografts (A-C) and allografts (D–F) at 14, 28 and 42 days post surgery. Sections were stained with Orange G/Alcian Blue (10X). Of note are the remarkable differences in the amount of the hyper-cellular fibrotic scar (*) surrounding 14-day and 28-day autografts (A & B) that appears to be minimal around the acellular allografts (C & D). By 42 days the scar tissue appears to have significantly remodeled in both autografts (E) and allografts (F). Graft tissue is marked G.
Figure 7
Figure 7
Gene expression of (A) Tgfb1, (B) Gdf5, and (C) Vegfa in FDL tendon autografts and allografts at 14 and 28 days post grafting. Total RNA was extracted and pooled from 3 tendon grafts and processed for real-time RT-PCR. Gene expression was standardized with the internal beta-actin control and then normalized by the level of expression in normal unoperated FDL tendon. Data presented as the mean fold induction (over normal unoperated tendon) ± SEM. * p < 0.05 vs. normal unoperated tendon.

References

    1. Taras JS, Lamb MJ. Treatment of flexor tendon injuries: surgeons' perspective. Journal of Hand Therapy. 1999;12:141–148. - PubMed
    1. Bunnell S. The injured hand; principles of treatment. Ind Med Surg. 1953;22:251–254. - PubMed
    1. Lilly SI, Messer TM. Complications after treatment of flexor tendon injuries. J Am Acad Orthop Surg. 2006;14:387–396. - PubMed
    1. Stark HH, Anderson DR, Zemel NP, Boyes JH, Ashworth CR, Rickard TA. Bridge flexor tendon grafts. Clin Orthop Relat Res. 1989:51–59. - PubMed
    1. Taras JS, Kaufmann RA. Flexor Tendon Reconstruction. In: Green DP, Hotchkiss RN, Pederson WC, Wolfe SW, editors. Green's Operative Hand Surgery. Fifth ed. Philadelphia: Elsevier Churchill Livingstone; 2005. pp. 241–276.

Publication types

MeSH terms

Substances