. 2008 Mar 1;586(5):1337-49.
doi: 10.1113/jphysiol.2007.144154. Epub 2008 Jan 10.

Glutamate receptor-dependent increments in lactate, glucose and oxygen metabolism evoked in rat cerebellum in vivo

Affiliations

Glutamate receptor-dependent increments in lactate, glucose and oxygen metabolism evoked in rat cerebellum in vivo

Kirsten Caesar et al. J Physiol. .

Abstract

Neuronal activity is tightly coupled with brain energy metabolism. Numerous studies have suggested that lactate is equally important as an energy substrate for neurons as glucose. Lactate production is reportedly triggered by glutamate uptake, and independent of glutamate receptor activation. Here we show that climbing fibre stimulation of cerebellar Purkinje cells increased extracellular lactate by 30% within 30 s of stimulation, but not for briefer stimulation periods. To explore whether lactate production was controlled by pre- or postsynaptic events we silenced AMPA receptors with CNQX. This blocked all evoked rises in postsynaptic activity, blood flow, and glucose and oxygen consumption. CNQX also abolished rises in lactate concomitantly with marked reduction in postsynaptic currents. Rises in lactate were unaffected by inhibition of glycogen phosphorylase, suggesting that lactate production was independent of glycogen breakdown. Stimulated lactate production in cerebellum is derived directly from glucose uptake, and coupled to neuronal activity via AMPA receptor activation.


Figures

Figure 2
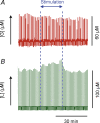
Figure 2. Climbing fibre stimulation evokes extracellular lactate increases in cerebellar cortex
A, raw data displaying lactate responses as result of stimulation. The trace is compressed 3 h time window displaying lactate current peaks at every 30 s. The start and end of the stimulations are denoted by red dotted lines. B, average lactate response signature to 5 Hz climbing fibre stimulation. Readings are averaged lactate readings adjusted and zeroed for time and concentration for ∼20 min (n = 7 in 1 animal). C, averaged lactate response signature to 5 Hz climbing fibre stimulation. Averaged stimulations (n = 16 in 5 animals) for ∼20 min. Values are mean ±s.e.m. of raw lactate readings zeroed for start time of stimulation and pre-stimulus lactate concentration.
Figure 4
Figure 4. Extracellular glucose is clamped during stimulation, but decreases rapidly during cardiac arrest
Raw data showing lactate and glucose responses to climbing fibre stimulation and cardiac arrest. Traces represent a compressed 1 h time window displaying glucose and lactate current peaks at every 30 s. The start and end of the stimulations are denoted by the blue dotted lines in A and B. During stimulation extracellular glucose remained constant (A), while extracellular lactate increased (B). Cardiac arrest was induced immediately and also dramatic decreases in extracellular glucose (C) simultaneously with large rises in extracellular lactate (D). This demonstrates the ability of our system to record dynamic glucose changes. Onset of cardiac arrest is indicated by the blue dotted line in C and D.
Figure 1
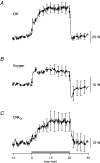
Figure 1. Synaptic activity, substrate supply and metabolism are coupled during cerebellar climbing fibre stimulation
The figure shows averaged data sets from 6 animals taken during 20 min climbing fibre stimulation at 5 Hz. The figure displays transient, simultaneous changes in CBF (A), tPO2 (B) and CMRO2 (C). CMRO2 values were calculated on the basis of CBF and tPO2 traces as previously described (Gjedde et al. 2005). All parameters reached a plateau ∼5 min after onset of stimulation and remained elevated until the end of stimulation. After the end of stimulation, tPO2 exhibited a profound undershoot before returning to baseline. Taken together, prolonged stimulation induced a new steady-state condition in the cerebellar cortex with respect to CBF, tPO2 and CMRO2.
Figure 3
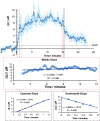
Figure 3. Supply and consumption of lactate are coupled during prolonged stimulation
High time resolution of lactate responses at 5 Hz climbing fibre stimulation. Measurements were at 12 s intervals. Values are mean ±s.e.m. (n = 10 in 3 animals) of raw lactate readings zeroed for start time of stimulation and pre-stimulus lactate concentration. The three lines of best fit were calculated using linear regression of the time periods indicated using Microsoft Excel. Upwards slope was 6.72 ± 0.32 μmol min−1 (F = 3.45 × 10⁻⁶), middle slope was 0.1209 ± 0.46 μmol min−1 (F = 0.0069), downward slope was 6.66 ± 0.89 μmol min−1 (F = 0.0175). This particular set of experiments yielded a slightly lower lactate transient than the averaged response. Also, due to the nature of sampling at high time resolution, responses were noisier, and this is reflected in the larger error bars in comparison to the averaged lactate trace shown in Fig. 2D. Dashed line indicates 2 ×s.d. of 5 min baseline period.
Figure 5
Figure 5. Activity-dependent rises in glucose use are blocked by AMPA receptor antagonists
Compared to the SHAM non-stimulated brain, climbing fibre stimulation (STIM) evoked modest but significant increases in glucose use, as measured by the 2DG method, in particular in the superior part of the cerebellar cortex, the region sampled by the CBF and microdialysis probes (blue box on the Nissl-stained section). Topical application of CNQX abolished this metabolic response (STIM + CNQX). All autoradiograms are colour-coded according to the same quantitative scale.
Figure 6
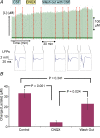
Figure 6. Activity-dependent rises in lactate are triggered by postsynaptic currents and blocked by AMPA receptor antagonists
Effect of topical application of CNQX on climbing fibre stimulation-evoked rises in extracellular lactate and LFP response amplitudes. A, top panel illustrates the times of superfusion with CSF, CSF + drug and wash-out of drug with CSF. The green forest of peaks below this correspond to the raw lactate levels, the red dotted lines indicate the start and end of stimulation. Below this are individual traces of LFPs; a typical example has been chosen for the designated time period. The figure shows that under control conditions (CSF) climbing fibre stimulation induced LFP responses and increases in extracellular lactate, while CNQX, a specific blocker of AMPA receptors, abolished both responses. Following a prolonged wash-out period, both LFP and lactate responses returned to control levels. B, histogram summarizing effect of CNQX on lactate response. The figure shows the averaged responses (n = 10 in 6 animals); values are mean ±s.e.m. displayed as a difference from zero. CNQX readings are taken from stimulations after 35 min of drug application. Wash-out readings were taken when the LFP response amplitudes began to gain amplitude. P values are calculated as a result of paired Student's t tests between individual values of the same animal.
Figure 7
Figure 7. Glycogen breakdown does not contribute to evoked rises in extracellular lactate
Extracellular lactate rises in live rat cerebellum evoked by stimulation was unaffected by topical application of DAB, a glycogen phosphorylase inhibitor. A, original data from one animal illustrating lactate responses under control conditions and following application of DAB. The green forest of peaks below this correspond to the raw lactate levels, the red dotted lines indicate the start and end of stimulation. DAB did not alter the baseline and the stimulated lactate increase remained unchanged following DAB. B, histogram showing effect of DAB on lactate response. Data are mean ±s.e.m. (n = 5 in 3 animals) of lactate increase for the control and DAB stimuli. DAB readings were taken from stimulations after 1.5 h of drug application. P values are calculated as a result of paired Student's t tests between individual values of the same animal.
Figure 8
Figure 8. Rises in extracellular lactate following cardiac arrest depend on glycogen breakdown
Response amplitude of lactate peak following cardiac arrest in control animals and in animals treated with DAB. A, raw lactate peaks from 2 experiments. In the control animal lactate increased ∼200% after cardiac arrest and stayed elevated for ∼5 min. After this it decreased slowly over the next 20 min until end of data acquisition, but never reaching baseline. In the DAB animal the cardiac arrest peak was ∼20% (a factor of 10 less), and persisted for only 1 min whereupon it decreased over the next 20 min to below baseline. The cardiac arrest response was reproducible in each of the animals that had received the drug. B, histograms showing the mean ±s.e.m. cardiac arrest peak amplitude of lactate in control animals (n = 6) versus DAB animals (n = 6). Following DAB treatment this peak virtually disappeared. This documents that DAB was effective in blocking glycogen phosphorylase in our experiments, and that the rises in lactate following cardiac arrest, but not during activation, were dependent on glycogen breakdown. P values are from unpaired Students t tests between the DAB and control groups

Comment in

Similar articles

Cited by

References

    1. Akgoren N, Fabricius M, Lauritzen M. Importance of nitric oxide for local increases of blood flow in rat cerebellar cortex during electrical stimulation. Proc Natl Acad Sci U S A. 1994;91:5903–5907. - PMC - PubMed
    1. Andersen B, Rassov A, Westergaard N, Lundgren K. Inhibition of glycogenolysis in primary rat hepatocytes by 1,4-dideoxy-1,4-imino-d-arabinitol. Biochem J. 1999;342:545–550. - PMC - PubMed
    1. Baude A, Molnar E, Latawiec D, Mcilhinney RAJ, Somogyi P. Synaptic and nonsynaptic localization of the Glur1 subunit of the AMPA-type excitatory amino-acid receptor in the rat cerebellum. J Neurosci. 1994;14:2830–2843. - PMC - PubMed
    1. Bergersen L, Waerhaug O, Helm J, Thomas M, Laake P, Davies AJ, Wilson MC, Halestrap AP, Ottersen OP. A novel postsynaptic density protein: the monocarboxylate transporter MCT2 is co-localized with δ-glutamate receptors in postsynaptic densities of parallel fiber-Purkinje cell synapses. Exp Brain Res. 2001;136:523–534. - PubMed
    1. Bergersen LH, Magistretti PJ, Pellerin L. Selective postsynaptic co-localization of MCT2 with AMPA receptor GluR2/3 subunits at excitatory synapses exhibiting AMPA receptor trafficking. Cerebr Cortex. 2005;15:361–370. - PubMed

Publication types

MeSH terms

LinkOut - more resources