

Effects of twin pregnancy and periconceptional undernutrition on maternal metabolism, fetal growth and glucose-insulin axis function in ovine pregnancy
- PMID: 18187465
- PMCID: PMC2375672
- DOI: 10.1113/jphysiol.2007.144071
Effects of twin pregnancy and periconceptional undernutrition on maternal metabolism, fetal growth and glucose-insulin axis function in ovine pregnancy
Abstract
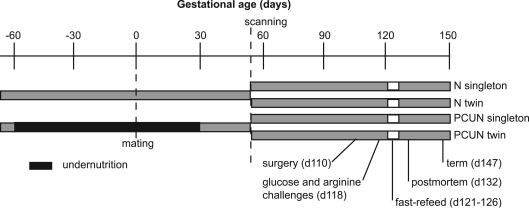
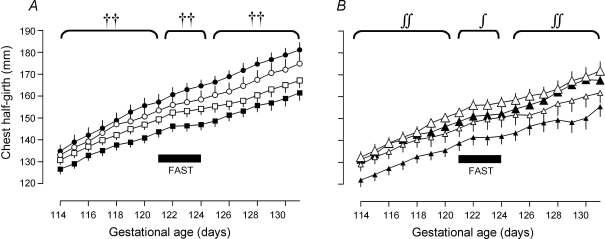
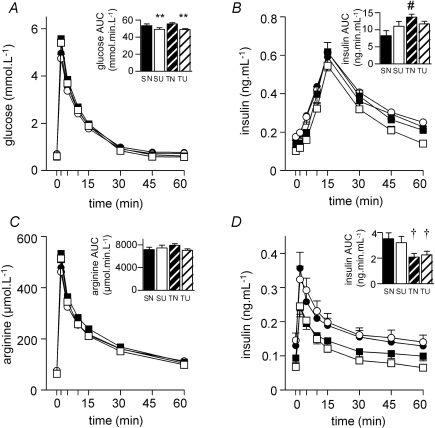
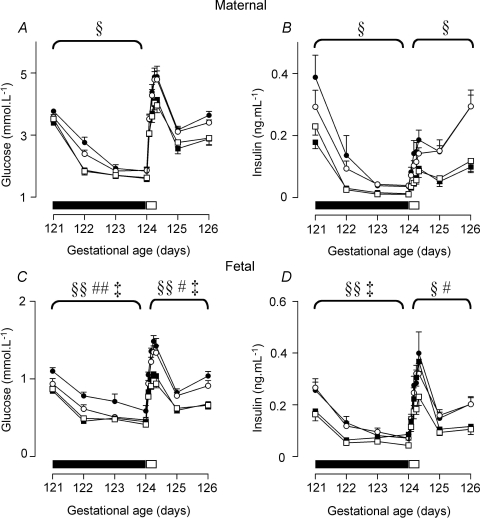
Although twins have lower birthweights than singletons, they may not experience the increased disease risk in adulthood reportedly associated with low birthweight. In contrast, another periconceptional event, maternal undernutrition, does not reduce birthweight but does affect fetal and postnatal physiology in sheep. We therefore studied maternal and fetal metabolism, growth and glucose-insulin axis function in late gestation in twin and singleton sheep pregnancies, either undernourished from 60 days before until 30 days after conception or fed ad libitum. We found that twin-bearing ewes had decreased maternal food intake in late gestation and lower maternal and fetal plasma glucose and insulin levels. Twin fetuses had fewer everted placentomes, grew slower in late gestation, and had a greater insulin response to a glucose challenge, but lesser response to arginine. In contrast, periconceptional undernutrition led to increased maternal food intake and a more rapid fall in maternal glucose levels in response to fasting. Periconceptional undernutrition increased the number of everted placentomes, and abolished the difference in insulin responses to glucose between twins and singletons. Thus, the physiology of twin pregnancy is quite different from that of singleton pregnancy, and is probably determined by a combination of factors acting in both early and late gestation. The inconsistency of the relationships between low birthweight and postnatal disease risk of twins may lie in their very different fetal development. These data suggest that twin pregnancy may be another paradigm of developmental programming, and indicate that twins and singletons must be examined separately in any study of fetal or postnatal physiology.
Figures
Comment in
-
Periconceptional nutrition, twinning and how this impacts on current understanding of the aetiology and pathophysiology of the metabolic syndrome.J Physiol. 2008 Mar 1;586(5):1203-4. doi: 10.1113/jphysiol.2007.150227. J Physiol. 2008. PMID: 18310128 Free PMC article. No abstract available.
Similar articles
-
Periconceptional nutrition and the relationship between maternal body weight changes in the periconceptional period and feto-placental growth in the sheep.J Physiol. 2005 May 15;565(Pt 1):111-24. doi: 10.1113/jphysiol.2005.084996. Epub 2005 Mar 17. J Physiol. 2005. PMID: 15774513 Free PMC article.
-
Effects of twinning and periconceptional undernutrition on late-gestation hypothalamic-pituitary-adrenal axis function in ovine pregnancy.Endocrinology. 2008 Mar;149(3):1163-72. doi: 10.1210/en.2007-1306. Epub 2007 Nov 29. Endocrinology. 2008. PMID: 18048493
-
Different periods of periconceptional undernutrition have different effects on growth, metabolic and endocrine status in fetal sheep.Pediatr Res. 2009 Dec;66(6):605-13. doi: 10.1203/PDR.0b013e3181bbde72. Pediatr Res. 2009. PMID: 19687774
-
Consequences of intra-uterine growth retardation for postnatal growth, metabolism and pathophysiology.Reprod Suppl. 2003;61:195-206. Reprod Suppl. 2003. PMID: 14635936 Review.
-
The effects of maternal nutrition around the time of conception on the health of the offspring.Soc Reprod Fertil Suppl. 2007;64:397-410. doi: 10.5661/rdr-vi-397. Soc Reprod Fertil Suppl. 2007. PMID: 17491161 Review.
Cited by
-
Differential pathways to adult metabolic dysfunction following poor nutrition at two critical developmental periods in sheep.PLoS One. 2014 Mar 6;9(3):e90994. doi: 10.1371/journal.pone.0090994. eCollection 2014. PLoS One. 2014. PMID: 24603546 Free PMC article.
-
Developmental outcomes in small-for-gestational age twins using a singleton vs twin birthweight reference.Am J Obstet Gynecol MFM. 2021 Nov;3(6):100465. doi: 10.1016/j.ajogmf.2021.100465. Epub 2021 Aug 18. Am J Obstet Gynecol MFM. 2021. PMID: 34416423 Free PMC article.
-
The effect of Ramadan fasting during pregnancy on perinatal outcomes: a systematic review and meta-analysis.BMC Pregnancy Childbirth. 2018 Oct 25;18(1):421. doi: 10.1186/s12884-018-2048-y. BMC Pregnancy Childbirth. 2018. PMID: 30359228 Free PMC article.
-
Increased risk of type 2 diabetes in elderly twins.Diabetes. 2009 Jun;58(6):1350-5. doi: 10.2337/db08-1714. Epub 2009 Mar 31. Diabetes. 2009. PMID: 19336677 Free PMC article.
-
Effects of Melatonin Supplementation during Pregnancy on Reproductive Performance, Maternal-Placental-Fetal Redox Status, and Placental Mitochondrial Function in a Sow Model.Antioxidants (Basel). 2021 Nov 24;10(12):1867. doi: 10.3390/antiox10121867. Antioxidants (Basel). 2021. PMID: 34942970 Free PMC article.
References
-
- Baird J, Osmond C, MacGregor A, Snieder H, Hales CN, Phillips DIW. Testing the fetal origins hypothesis in twins: the Birmingham twin study. Diabetologia. 2001;44:33–39. - PubMed
-
- Bergvall N, Iliadou A, Johansson S, de Faire U, Kramer MS, Pawitan Y, Pedersen NL, Lichtenstein P, Cnattingius S. Genetic and shared environmental factors do not confound the association between birth weight and hypertension: a study among Swedish twins. Circulation. 2007;115:2931–2938. - PubMed
-
- Bloomfield FH, Oliver MH, Giannoulias CD, Gluckman PD, Harding JE, Challis JR. Brief undernutrition in late-gestation sheep programs the hypothalamic-pituitary-adrenal axis in adult offspring. Endocrinology. 2003a;144:2933–2940. - PubMed
-
- Bloomfield FH, Oliver MH, Harding JE. Effects of twinning, birth size and postnatal growth on glucose tolerance and hypothalamo-pituitary-adrenal function in post-pubertal sheep. Am J Physiol Endocrinol Metab. 2007;292:E231–E237. - PubMed
Publication types
MeSH terms
Substances
LinkOut - more resources
Full Text Sources
Medical