. 2008 Mar;36(4):1321-33.
doi: 10.1093/nar/gkm1138. Epub 2008 Jan 10.

Conserved elements with potential to form polymorphic G-quadruplex structures in the first intron of human genes

Affiliations

Conserved elements with potential to form polymorphic G-quadruplex structures in the first intron of human genes

Johanna Eddy et al. Nucleic Acids Res. 2008 Mar.

Abstract

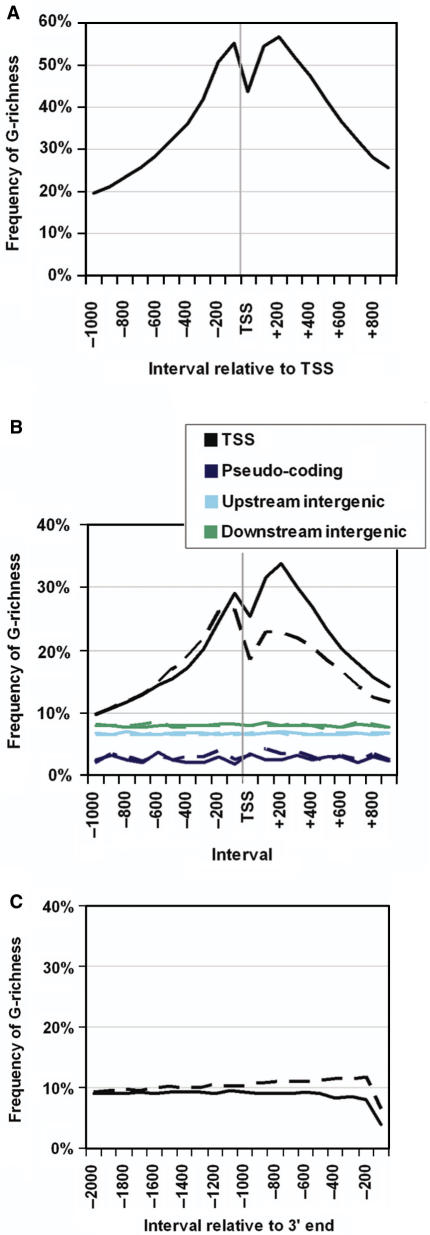
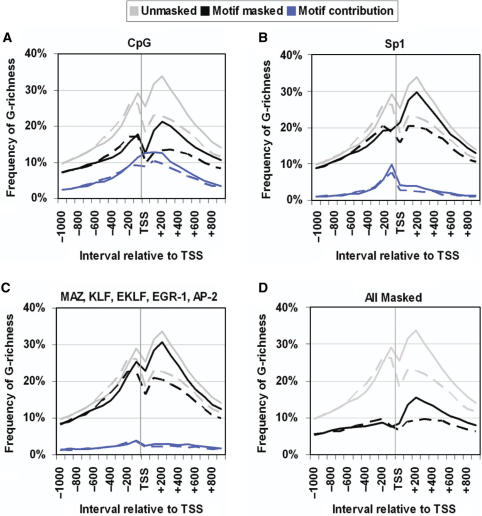
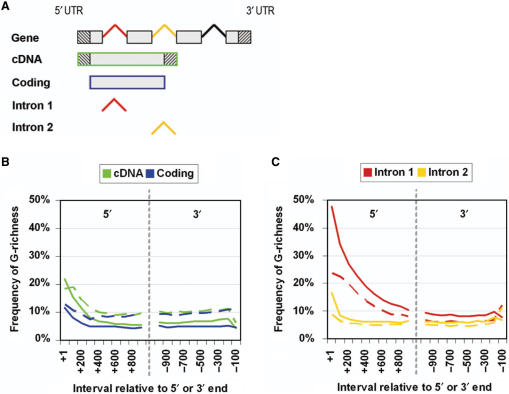
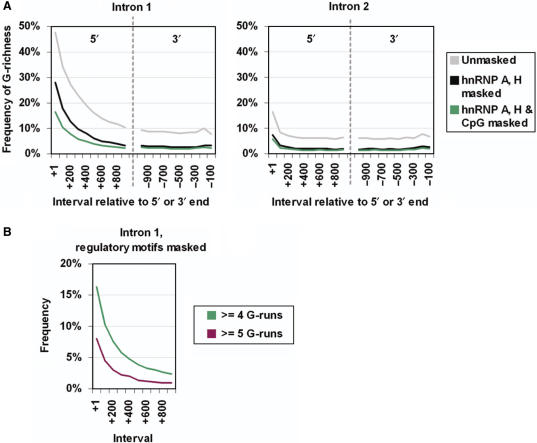
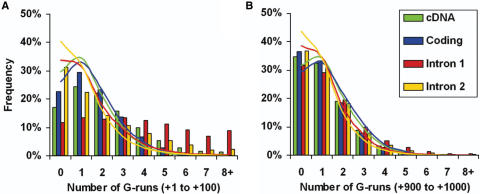
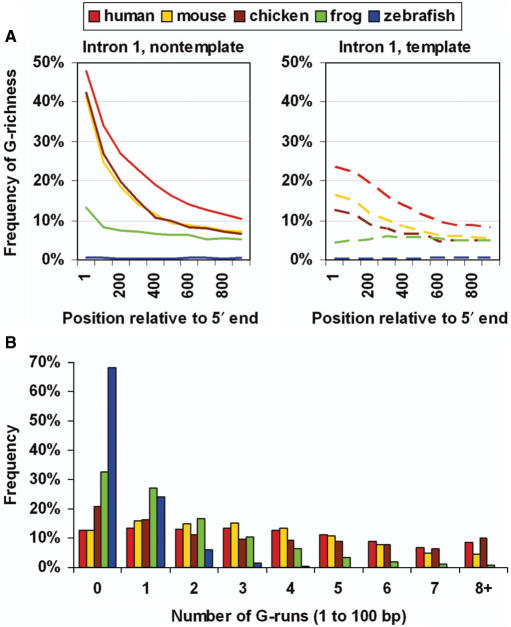
To understand how potential for G-quadruplex formation might influence regulation of gene expression, we examined the 2 kb spanning the transcription start sites (TSS) of the 18 217 human RefSeq genes, distinguishing contributions of template and nontemplate strands. Regions both upstream and downstream of the TSS are G-rich, but the downstream region displays a clear bias toward G-richness on the nontemplate strand. Upstream of the TSS, much of the G-richness and potential for G-quadruplex formation derives from the presence of well-defined canonical regulatory motifs in duplex DNA, including CpG dinucleotides which are sites of regulatory methylation, and motifs recognized by the transcription factor SP1. This challenges the notion that quadruplex formation upstream of the TSS contributes to regulation of gene expression. Downstream of the TSS, G-richness is concentrated in the first intron, and on the nontemplate strand, where polymorphic sequence elements with potential to form G-quadruplex structures and which cannot be accounted for by known regulatory motifs are found in almost 3000 (16%) of the human RefSeq genes, and are conserved through frogs. These elements could in principle be recognized either as DNA or as RNA, providing structural targets for regulation at the level of transcription or RNA processing.


Figures

Figure 1.
Figure 1.
Strand-biased G-richness in human genes. Percentage of genes with four or more G-runs per 100 bp interval was calculated for the indicated regions: (A) G-richness of duplex DNA within the 2 kb window spanning the TSS; analysis includes 18 217 human RefSeq genes. (B) Strand bias of G-richness. Nontemplate strands (solid lines) and template strands (dashed lines) of human RefSeq genes (black); 1000 random pseudo-coding sequences (blue); intergenic sequences 3 kb upstream of the TSS (cyan); and intergenic sequences 3 kb downstream of the 3′ ends of the genes (green). G-richness of nontemplate and template strands is indistinguishable within intergenic sequences. (C) Strand bias of G-richness within 2 kb of the 3′ ends of genes. Nontemplate strands (solid line) and template strands (dashed line).
Figure 2.
Figure 2.
G-richness upstream but not downstream of the TSS can be attributed to canonical regulatory motifs in duplex DNA. Percentage of genes in which G-richness of nontemplate (solid lines) and template (dashed lines) strands was contributed by specific motifs was analyzed for all 18 217 human RefSeq genes within the 2 kb window spanning the TSS. In each panel G-richness of unmasked sequences is shown for comparison (gray). Motifs tested were: (A) G-richness contributed solely by CpG dinucleotides (blue); G-richness calculated with CpG dinucleotides masked (black). Gaussian fit (data not shown) for nontemplate strand G-richness contributed by CpG dinucleotides only, represented by the solid blue line (R2 = 0.99). (B) G-richness contributed solely by SP1 motifs (blue); G-richness calculated with SP1 motifs masked (black). Gaussian fits (data not shown) for nontemplate strand, SP1 motifs only (R2 = 0.80); and for SP1 motifs masked (R2 = 0.95). (C) G-richness contributed by motifs for 5 transcription factors, MAZ, KLF, EKLF, EGR-1, and AP-2 (blue); G-richness with these 5 transcription factor motifs masked (black). (D) G-richness with CpG dinucleotides and motifs for transcription factors SP1, MAZ, KLF, EKLF, EGR-1 and AP-2 masked (black).
Figure 3.
Figure 3.
G-richness mapped to functional regions within human genes. (A) Diagram of a prototype gene with 5′ UTR (reverse hatched boxes), coding exons (gray boxes), introns (carats), and 3′ UTR (forward hatched boxes) indicated. (B) G-richness of 19 056 unique cDNA sequences (green), and 13 640 unique coding sequences (blue). G-richness was calculated for the first 1 kb of each sequence relative to the 5′ end, and the last 1 kb of each sequence relative to the 3′ end, for specific elements of a typical gene, for all sequences greater than 1 kb in length, and distinguishing nontemplate (solid lines) and template (dashed lines) strands. Vertical lines separate analyses of 5′ and 3′ regions. (C) G-richness of 13 433 unique first intron sequences (red), and 11 540 unique second intron sequences (gold). Analyses and notations as in (C).
Figure 4.
Figure 4.
hnRNP A and hnRNP H motifs and CpG dinucleotides contribute to but do not account for G-richness of human first introns. (A) Percentage of 13 433 unique first intron sequences (left) or 11 540 unique second intron sequences (right) in which G-richness of nontemplate (solid lines) strands was contributed by specific motifs, within the first 1 kb of each sequence relative to the 5′ end, and the last 1 kb of each sequence relative to the 3′ end, for all sequences that are greater than 1 kb in length. G-richness of unmasked sequences (gray) is shown for comparison with G-richness with motifs for hnRNP A and hnRNP H masked (black), and hnRNP A and hnRNP H plus CpG dinucleotides masked (green). Vertical lines separate the 5′ and 3′ analyses. (B) Multiplicity of G-runs in first intron sequences with motifs for hnRNP A and hnRNP H and CpG dinucleotides masked. G-richness with four or more G-runs (green) as in (A), and G-richness redefined as five or more G-runs (plum).
Figure 5.
Figure 5.
The G-rich element at the 5′ end of first introns has high potential to form polymorphic G-quadruplex structures. Numbers of G-runs were enumerated in 100 nt intervals within the nontemplate strand for each specific element of a typical gene (Figure 3A), including cDNA (green), coding (blue), first intron (red) and second intron (gold), for all sequences greater than 100 bp in length. The distribution of numbers of G-runs is shown for two intervals, comparing the observed value of each genomic region (bars) to the value predicted based upon analysis of the same sequences randomly shuffled (lines). Intervals analyzed were: (A) 100 nt interval from +1 to +100 relative to the 5′ end. (B) 100 nt interval from +900 to +1000 relative to the 5′ end.
Figure 6.
Figure 6.
The G-rich element at the 5′ end of first introns is conserved. Comparison of G-richness of the first intron sequences of human (red), mouse (gold), chicken (brown), frog (green) and zebrafish (blue). (A) G-richness was calculated for first intron sequences of mouse (11 816), chicken (3399), frog (4193), zebrafish (5787), and compared with human (13 433). Regions analyzed were the 100 nt interval from +1 to +100 relative to the 5′ end, for all unique first introns greater than 1 kb in length, for the nontemplate strand (left, solid lines), and template strand (right, dashed lines). (B) Distribution of numbers of G-runs in the first 100 nt of the nontemplate strand of the first intron, for all unique intron sequences greater than 100 bp.

Similar articles

Cited by

References

    1. Phan AT, Kuryavyi V, Patel DJ. DNA architecture: from G to Z. Curr. Opin. Struct. Biol. 2006;16:288–298. - PMC - PubMed
    1. Maizels N. Dynamic roles for G4 DNA in the biology of eukaryotic cells. Nat. Struc. Mol. Biol. 2006;13:1055–1059. - PubMed
    1. Burge S, Parkinson GN, Hazel P, Todd AK, Neidle S. Quadruplex DNA: sequence, topology and structure. Nucleic Acids Res. 2006;34:5402–5415. - PMC - PubMed
    1. Rachwal PA, Brown T, Fox KR. Effect of G-tract length on the topology and stability of intramolecular DNA quadruplexes. Biochemistry. 2007;46:3036–3044. - PubMed
    1. Rachwal PA, Findlow IS, Werner JM, Brown T, Fox KR. Intramolecular DNA quadruplexes with different arrangements of short and long loops. Nucleic Acids Res. 2007;35:4214–4222. - PMC - PubMed

Publication types

Substances