. 2008 Mar;36(4):1343-57.
doi: 10.1093/nar/gkm1068. Epub 2008 Jan 10.

Saccharomyces cerevisiae HMO1 interacts with TFIID and participates in start site selection by RNA polymerase II

Affiliations

Saccharomyces cerevisiae HMO1 interacts with TFIID and participates in start site selection by RNA polymerase II

Koji Kasahara et al. Nucleic Acids Res. 2008 Mar.

Abstract

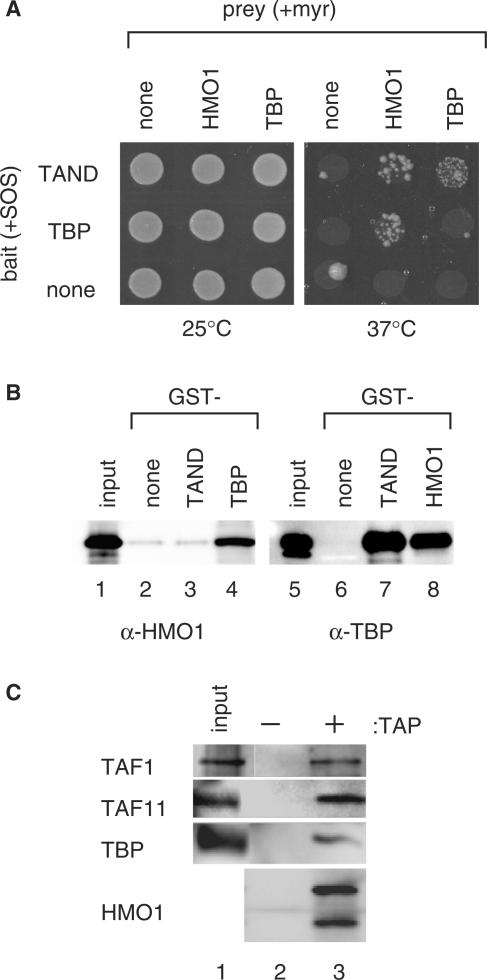
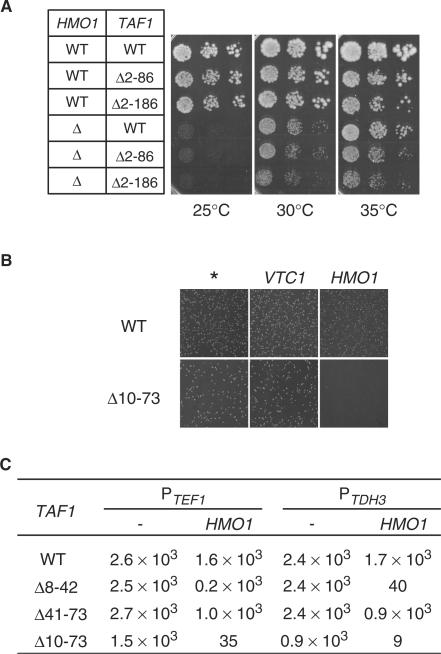
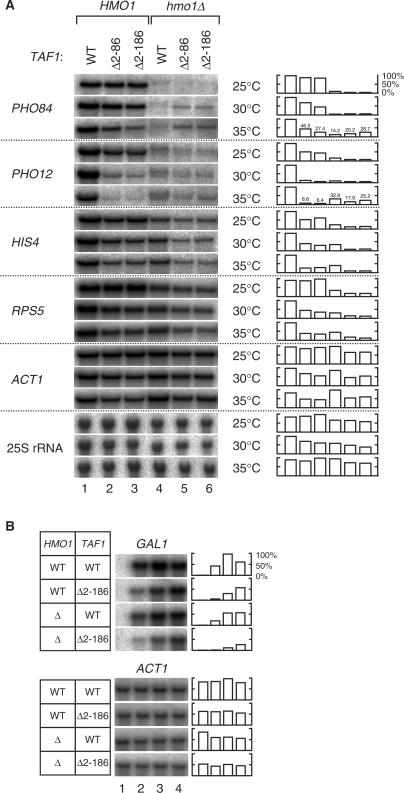
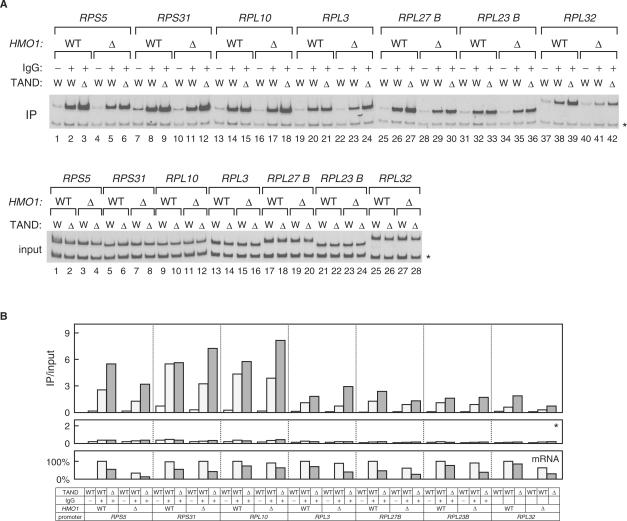
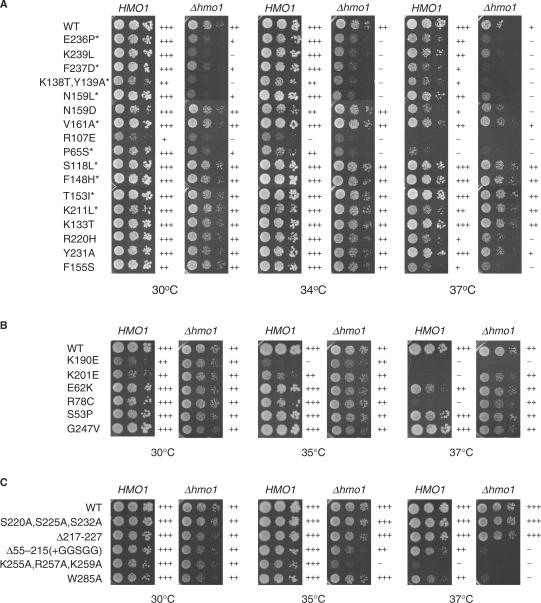
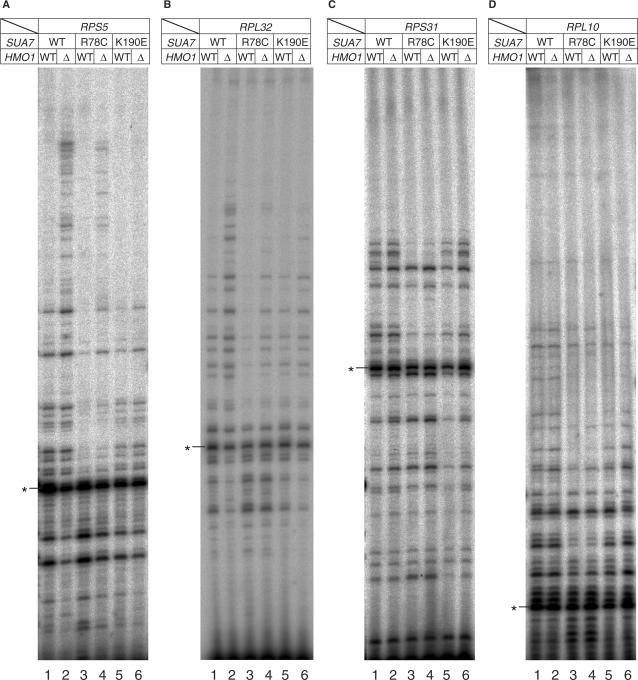
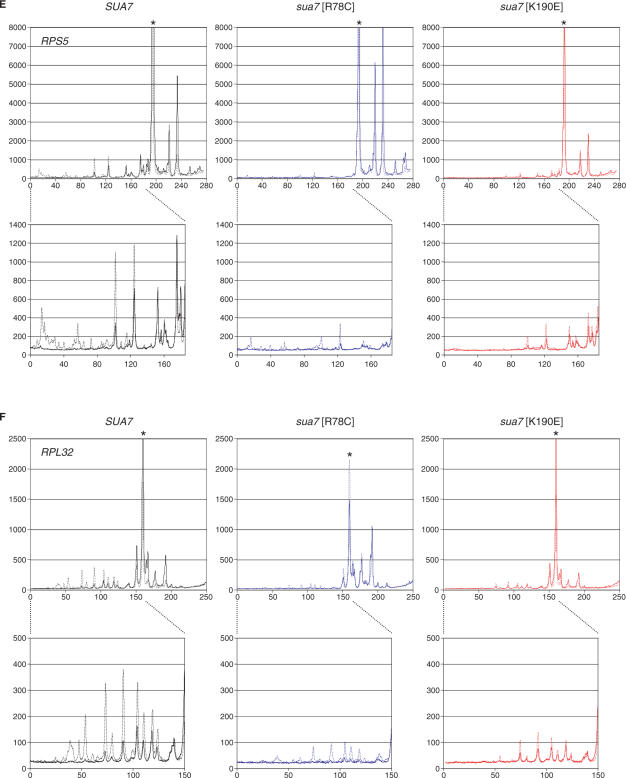
Saccharomyces cerevisiae HMO1, a high mobility group B (HMGB) protein, associates with the rRNA locus and with the promoters of many ribosomal protein genes (RPGs). Here, the Sos recruitment system was used to show that HMO1 interacts with TBP and the N-terminal domain (TAND) of TAF1, which are integral components of TFIID. Biochemical studies revealed that HMO1 copurifies with TFIID and directly interacts with TBP but not with TAND. Deletion of HMO1 (Deltahmo1) causes a severe cold-sensitive growth defect and decreases transcription of some TAND-dependent genes. Deltahmo1 also affects TFIID occupancy at some RPG promoters in a promoter-specific manner. Interestingly, over-expression of HMO1 delays colony formation of taf1 mutants lacking TAND (taf1DeltaTAND), but not of the wild-type strain, indicating a functional link between HMO1 and TAND. Furthermore, Deltahmo1 exhibits synthetic growth defects in some spt15 (TBP) and toa1 (TFIIA) mutants while it rescues growth defects of some sua7 (TFIIB) mutants. Importantly, Deltahmo1 causes an upstream shift in transcriptional start sites of RPS5, RPS16A, RPL23B, RPL27B and RPL32, but not of RPS31, RPL10, TEF2 and ADH1, indicating that HMO1 may participate in start site selection of a subset of class II genes presumably via its interaction with TFIID.


Figures

Figure 1.
Figure 1.
HMO1 interacts with components of TFIID. (A) HMO1 interacts with TAND and TBP in the Sos recruitment system. Saccharomyces cerevisiae cdc25H was transformed with the indicated combinations of plasmids and grown on appropriately supplemented 2% galactose and 1% raffinose minimal medium at 25°C (left panel) or 37°C (right panel) for 5 days. Note the revertant colonies (false positives) that did not grow uniformly in inoculated areas. (B) HMO1 binds TBP, but not TAND. GST pulldown assays were performed by incubating HMO1 (200 pmol in lanes 2–4) or TBP (40 pmol in lanes 6–8) with GST-TAND (20 pmol in lanes 3 and 7), GST-TBP (20 pmol in lane 4), GST-HMO1 (25 pmol in lane 8) and GST (60 pmol in lanes 2 and 6). Aliquots of 4% of the total input of HMO1 and TBP are shown in lanes 1 and 5, respectively. Proteins were separated by 10% SDS–PAGE and visualized by immunoblotting using antibodies specific for the proteins indicated. (C) HMO1 co-purifies with TFIID. Cell lysates prepared from strains expressing TAP-tagged or un-tagged HMO1 were purified as described previously (49) with minor modifications. Purified fractions containing TAP-tagged (lane 3) or un-tagged (lane 2) HMO1 were separated by 7% (TAF1), 10% (TAF11) or 12% (HMO1, TBP) SDS–PAGE and visualized by immunoblotting using antibodies against the proteins indicated at the left. TAP-tagged lysates (0.01% of input) are shown in lane 1.
Figure 2.
Figure 2.
Genetic interaction between HMO1 and TAND. (A) Effect of Δhmo1 and taf1ΔTAND on growth. Strains carrying a combination of HMO1 or Δhmo1 and TAF1, taf1ΔTAND (2–86 aa) or taf1ΔTAND (2–186 aa), as indicated at the left, were spotted onto YPD plates at three dilutions and grown at 25°C, 30°C or 35°C for 3 days. (B) The effect of HMO1 overexpression on growth. Strains carrying TAF1 or taf1ΔTAND (10–73 aa) were transformed with pM2950 or pM2956 to overexpress HMO1 or VTC1, respectively, or with empty plasmid (pM2959, asterisk, negative control). A region of each plate containing transformants cultured at 30°C for 2.5 days is shown. (C) TAND1 or TAND2 are required to reduce the toxicity of HMO1 overexpression. As shown in B, strains carrying TAF1, taf1ΔTAND (8–42 aa), taf1ΔTAND (41–73 aa) or taf1ΔTAND (10–73 aa) were transformed with fixed amounts (100 ng) of empty plasmid (−) or plasmid overexpressing HMO1 (pM2949 and pM2950) from the TEF1 or TDH3 promoters, respectively. Following incubation at 30°C for 2.5 days, the number of transformants were counted.
Figure 3.
Figure 3.
The effect of Δhmo1 on transcription of class II genes. (A) Transcription of TAND-dependent genes in Δhmo1 and/or taf1ΔTAND mutants. Northern blot analysis was used to determine the expression of PHO84, PHO12, HIS4, RPS5, ACT1 and 25S rRNA in the indicated strains. Total RNA (20 μg) was blotted onto the membrane and hybridized with the gene-specific probes indicated at the left. The raw data (left panel) were quantified and are presented graphically in the right panel. Values for each transcript were normalized to the maximum expression of that transcript. (B) Transcription of an inducible gene in Δhmo1 and/or taf1ΔTAND mutants. Expression of GAL1 (inducible) and ACT1 (constitutive, control) was measured by northern blot analysis in the indicated strains. Cultures were grown in 3% raffinose synthetic medium to mid-log phase at 30°C, then the same volume of 4% galactose synthetic medium was added and the cultures grown for 3 h at 30°C. Aliquots of the culture were harvested at t = 0, 0.5, 1 and 3 h (lanes 1–4, respectively) after addition of galactose. Total RNA was isolated from these samples and then analyzed as described in A.
Figure 4.
Figure 4.
In vivo association of TAF1 with RPG promoters. (A) In vivo binding of TAF1 to the promoter region of RPS5, RPS31, RPL10, RPL3, RPL27B, RPL23B and RPL32 was analyzed using ChIP assays. Yeast strains were grown in YPD medium to mid-log phase at 25°C. Cross-linked chromatin from HMO1 or Δhmo1 strains expressing TAP-tagged TAF1, with or without the TAF N-terminal domain (TAND; 2–186 aa), as indicated, was prepared and precipitated with either IgG-Sepharose 6 FastFlow (IgG; +) or Sepharose 6 FastFlow (IgG; −, negative control) beads. After reversal of cross-linking, PCR was performed to test for the presence of DNA corresponding to the promoter regions of the indicated genes. Each PCR reaction contained a second primer pair that amplifies a region (218 bp) of the POL1 ORF as an internal background control (asterisk) (27). The lower panel (input) shows the results of PCR conducted with the chromatin prior to precipitation. (B) Quantitation of the raw data shown in A. Signals corresponding to each band were quantified by an image analyzer after staining with SYBR Green I. The ratio of the precipitated signal (IP) to the input signal from each lysate (table at bottom) was calculated for all the indicated RPG promoters (top panel) as well as for the POL1 ORF (middle panel). Northern blot analysis was also conducted as described in Figure 3A. The raw data (data not shown) were quantified and are presented graphically in the bottom panel. Values for each transcript were normalized to the maximum expression of that transcript.
Figure 5.
Figure 5.
Genetic interaction between HMO1 and SPT15(TBP), SUA7(TFIIB), TOA1(TFIIA). (A). Effect of Δhmo1 and spt15 on growth. The Δspt15 and Δspt15 Δhmo1 strains carrying plasmid encoding SPT15 (WT) or spt15 mutant alleles (indicated at the left) were spotted onto YPD plates at three dilutions and grown for 5 days at the temperatures indicated. Relative growth rates are indicated at the right. Mutants marked with an asterisk are deficient in Pol II-dependent but not Pol I-dependent transcription (59–63). (B) Effect of Δhmo1 and sua7 on growth. The Δsua7 and Δsua7 Δhmo1 strains carrying plasmid encoding SUA7 (WT) or sua7 mutant alleles were grown as described in A. (C) Effect of Δhmo1 and toa1 on growth. The Δtoa1 and Δtoa1 Δhmo1 strains carrying plasmid encoding TOA1 (WT) or toa1 mutant alleles were grown as described in A.
Figure 6.
Figure 6.
The effect of Δhmo1 on start site selection of class II genes in sua7 mutants. (A) Transcriptional start sites of RPS5 in Δhmo1 and/or sua7 mutants. Total RNA (20 μg) from strains containing the alleles indicated at the top was isolated 2 h after a temperature shift to 37°C from 30°C before being subjected to primer extension analysis. The position of a major transcriptional start site (C at −37 numbered relative to the A (+1) of the start codon ATG) is indicated by the asterisk. (B). Transcriptional start sites of RPL32 in Δhmo1 and/or sua7 mutants. Primer extension analysis was done as described in A. A major transcriptional start site at −365 is indicated by the asterisk. (C) Transcriptional start sites of RPS31 in Δhmo1 and/or sua7 mutants. Primer extension analysis was done as described in A. A major transcriptional start site at −57 is indicated by the asterisk. (D) Transcriptional start sites of RPL10 in Δhmo1 and/or sua7 mutants. Primer extension analysis was done as described in A. A major transcriptional start site at −21 is indicated by the asterisk. (E) Each lane of the electropherogram shown in A was scanned and quantified by densitometry (Multi Gauge ver.3.0, Fuji Film) (SUA7, left panel; sua7-R78C, center panel; sua7-K190E, right panel). The solid and broken lines represent the results obtained from HMO1 and Δhmo1 strains, respectively. Asterisks indicate the peaks that correspond to the major transcriptional start sites described in A. The upstream regions were expanded and are shown in the lower panels to make the differences between HMO1 and Δhmo1 strains more evident. (F) Each lane of the electropherogram shown in B was scanned and presented as described in E. (G) Each lane of the electropherogram shown in C was scanned and presented as described in E. (H) Each lane of the electropherogram shown in D was scanned and presented as described in E.
Figure 6.
Figure 6.
The effect of Δhmo1 on start site selection of class II genes in sua7 mutants. (A) Transcriptional start sites of RPS5 in Δhmo1 and/or sua7 mutants. Total RNA (20 μg) from strains containing the alleles indicated at the top was isolated 2 h after a temperature shift to 37°C from 30°C before being subjected to primer extension analysis. The position of a major transcriptional start site (C at −37 numbered relative to the A (+1) of the start codon ATG) is indicated by the asterisk. (B). Transcriptional start sites of RPL32 in Δhmo1 and/or sua7 mutants. Primer extension analysis was done as described in A. A major transcriptional start site at −365 is indicated by the asterisk. (C) Transcriptional start sites of RPS31 in Δhmo1 and/or sua7 mutants. Primer extension analysis was done as described in A. A major transcriptional start site at −57 is indicated by the asterisk. (D) Transcriptional start sites of RPL10 in Δhmo1 and/or sua7 mutants. Primer extension analysis was done as described in A. A major transcriptional start site at −21 is indicated by the asterisk. (E) Each lane of the electropherogram shown in A was scanned and quantified by densitometry (Multi Gauge ver.3.0, Fuji Film) (SUA7, left panel; sua7-R78C, center panel; sua7-K190E, right panel). The solid and broken lines represent the results obtained from HMO1 and Δhmo1 strains, respectively. Asterisks indicate the peaks that correspond to the major transcriptional start sites described in A. The upstream regions were expanded and are shown in the lower panels to make the differences between HMO1 and Δhmo1 strains more evident. (F) Each lane of the electropherogram shown in B was scanned and presented as described in E. (G) Each lane of the electropherogram shown in C was scanned and presented as described in E. (H) Each lane of the electropherogram shown in D was scanned and presented as described in E.

References

    1. Mellor J. The dynamics of chromatin remodeling at promoters. Mol. Cell. 2005;19:147–157. - PubMed
    1. Hahn S. Structure and mechanism of the RNA polymerase II transcription machinery. Nat. Struct. Mol. Biol. 2004;11:394–403. - PMC - PubMed
    1. Taatjes DJ, Marr MT, Tjian R. Regulatory diversity among metazoan co-activator complexes. Nat. Rev. Mol. Cell Biol. 2004;5:403–410. - PubMed
    1. Ptashne M. Regulation of transcription: from lambda to eukaryotes. Trends Biochem. Sci. 2005;30:275–279. - PubMed
    1. Govind CK, Yoon S, Qiu H, Govind S, Hinnebusch AG. Simultaneous recruitment of coactivators by Gcn4p stimulates multiple steps of transcription in vivo. Mol. Cell Biol. 2005;25:5626–5638. - PMC - PubMed

Publication types

MeSH terms

Substances