. 2008 Mar;36(5):1415-28.
doi: 10.1093/nar/gkm1046. Epub 2008 Jan 10.

A balance between NF-Y and p53 governs the pro- and anti-apoptotic transcriptional response

Affiliations

A balance between NF-Y and p53 governs the pro- and anti-apoptotic transcriptional response

Paolo Benatti et al. Nucleic Acids Res. 2008 Mar.

Abstract

The transcription factor NF-Y is a trimer with histone-like subunits that binds and activates CCAAT-containing promoters. NF-Y controls the expression of several key regulators of the cell cycle. In this study, we examined the functional and molecular effects of NF-YB knockdown. Cell cycle progression is affected with a G2/M-specific depletion. This is due to the inability of activation of G2/M-specific genes, as evidenced by expression profiling, RT-PCR and ChIP data. Surprisingly, apoptosis is also observed, with Caspase 3/7/8 cleavage. A role of p53 and Bcl-2 family members is important. NF-YB inactivation is sufficient to functionally activate p53, in the absence of DNA damage. Failure to maintain a physiologic level of CCAAT-dependent transcription of anti-apoptotic genes contributes to impairment of Bax/Bcl-2 and Bax/Bcl-X(L) ratios. Our data highlight the importance of fine balancing the NF-Y-p53 duo for cell survival by (i) maintaining transcription of anti-apoptotic genes and (ii) preventing p53 activation that triggers the apoptotic cascade.


Figures
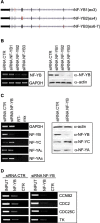
Figure 1.
Figure 1.
NF-YB RNAi in HCT116 cells. (A) Three siRNA were designed on human NF-YB gene. Black boxes represent exons; red boxes indicate targeted exons. (B) Left panel: RT-PCR analysis of NF-YB and GAPDH mRNA transcripts in negative control and NF-YB1-2-3-silenced cells. Right panel: western blot analysis of HCT116 total extracts with anti-NF-YB and anti-actin antibodies, transfected with control and NF-YB siRNAs. (C) RT-PCR (left panel) and western blot analysis (right panel) of the three NF-Y subunits in control or NF-YB2 transfected cells. (D) Chromatin immunoprecipitation analysis of NF-Y targets, using control and NF-YB-silenced HCT116 cells with NF-YB and Flag antibodies.
Figure 2.
Figure 2.
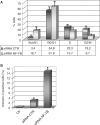
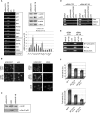
Cell cycle progression in HCT116 NF-YB-silenced cells. (A) Cell cycle distribution analysis via flow cytometry of HCT116 cells, transfected NF-YB and non-targeting control siRNA. (B) Apoptosis was determined by staining with annexin V; the values represent the portion of annexin V staining cells. Error bars indicate standard deviations.
Figure 3.
Figure 3.
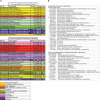
Microarray data analysis. (A) Gene Ontology terms displaying a statistically significant over-representation in the sample-set (up- and down-regulated genes, respectively). Parameter ‘genes’ is the number of genes annotated by the corresponding term in the sample set; parameter ‘P-value’ refers to the over-representation (see Methods section for statistical details); parameter ‘ratio’ is calculated as the ratio between term frequency in the sample set versus the universe set (all microarray genes). Terms have been pruned, and then grouped according to manually determined macro-categories, identified by different colors: see the legend for the categories names; categories with similar colors are functionally related. (B) Down-regulated genes, annotated by GO terms ‘M Phase’, both ‘Cell Cycle’ and ‘Microtubule Cytoskeleton’. IDs are expressed according to NCBI Entrez Gene.
Figure 4.
Figure 4.
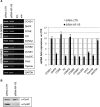
Expression analysis of NF-Y targets in NF-YB-silenced HCT116 cells. (A) RNA expression levels of the indicated NF-Y target genes relative to RNA levels in control and NF-YB-silenced cells (left panel). Quantification of the RT-PCRs, relative to control siRNA expression levels, is plotted in the right panel. Error bars indicate standard deviations. (B) Cyclin A and Cyclin B1 expression analysis of total extracts of HCT116 non-targeting control or NF-YB siRNA transfected cells.
Figure 5.
Figure 5.
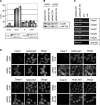
NF-YB silencing induces apoptosis via caspases activation. (A) Cell cycle distribution analysis via flow cytometry of non-targeting control and NF-YB siRNA transfected cells, untreated or treated with ZVAD. (B) Western blot analysis of negative control and NF-YB-silenced HCT116 total extracts with anti-NF-YB and anti-actin antibodies, untreated or treated with ZVAD. (C) Expression analysis (RT-PCR) of the indicated caspase mRNA transcripts. (D) Immunofluorescence analysis of the indicated cleaved caspases and HOECHST.
Figure 6.
Figure 6.
Activation of p53 and its target genes upon NF-YB silencing. (A) Left panel: RT-PCR analysis of the indicated mRNA transcripts in control and NF-YB-silenced cells. RNA expression levels of the indicated genes are quantitated relative to control siRNA transfected cells (lower right panel). Upper right panel: total extracts subjected to western immunoblotting using anti-p53, anti-bax and anti-actin antibodies. (B) Left panel: p53 and HOECHST staining of non-targeting control and NF-YB siRNA-transfected cells. Right panel: DNA damage was detected by H2AX staining of negative control and NF-YB siRNA transfected and Adriamycin-treated HCT116 cells. (C) Western blot analysis with anti-phospho Ser15 p53 and anti-actin antibodies of cell lysates from control siRNA, Adriamycin-treated and NF-YB siRNA-transfected cells. (D) ChIP assays of control and NF-YB-silenced cells of Bax, Mdm2 and Bcl-2 promoters, with the indicated antibodies. (E) Chromatin of control and NF-YB-silenced cells was immunoprecipitated with anti-NF-YB and Flag antibodies. PCR amplifications were performed with primers for BI-1 proximal promoter, BI-1 upstream promoter and Bcl-2. (F) Dose–response analysis (100–300 ng) of NF-YA DN in HCT116 cells with BI-1 and Bcl-2 reporters. Error bars indicate standard deviations.
Figure 7.
Figure 7.
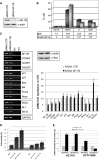
Role of p53 in apoptosis induction. (A) Expression levels of NF-YB and actin in HCT116/E6 upon NF-YB silencing. (B) Cell cycle progression analysis by FACS of control and NF-YB-silenced HCT116/E6 cells. Error bars indicate standard deviations. (C) Left panel: RT-PCR analysis of G2/M, pro- and anti-apoptotic genes upon NF-YB siRNA transfection. PCR amplified genes are indicated and their quantitation, relative to control expression levels, is plotted in the right lower panel. Right upper panel: total extracts subjected to western immunoblotting using anti-bax and anti-actin antibodies. (D) Dose–response analysis (50–100 ng) of NF-Y in HCT116/E6 cells with Bcl-2 reporter. Error bars indicate standard deviations (E) The histogram represents the Bax/Bcl-2 and Bax/Bcl-XL mRNA ratios in HCT116 and HCT116/E6 NF-YB-silenced cells.
Figure 8.
Figure 8.
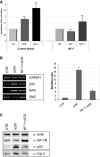
Overexpression of NF-Y prevents p53-mediated apoptosis. (A) Apoptosis fold activation in control cells and in NF-Y overexpressing cells concurrently with Adriamycin treatment. Error bars indicate standard deviations. (B) Left panel: RT-PCR analysis of p53, Bax and Bcl-2 genes upon Adriamycin and NF-Y overexpression concurrently with Adriamycin treatment. Right panel: the histogram represents the Bax/Bcl-2 mRNA ratios in Adriamycin and NF-Y overexpressing/Adriamycin-treated cells. Error bars indicate standard deviations. (C) Upper panel: total extracts subjected to western immunoblotting using anti-actin, anti-NF-YB and anti-p53 antibodies. Lower panel: isolated cytosolic fractions of control, Adriamycin and NF-Y overexpressing/Adriamycin-treated cells, subjected to western blot analysis with anti-cytochrome C antibody.
Figure 9.
Figure 9.
A model of the fine balance between p53 and NF-Y regulated genes.

Similar articles

Cited by

References

    1. Bucher P. Weight matrix descriptions of four eukaryotic RNA polymerase II promoter elements derived from 502 unrelated promoter sequences. J. Mol. Biol. 1990;212:563–578. - PubMed
    1. Suzuki Y, Tsunoda T, Sese J, Taira H, Mizushima-Sugano J, Hata H, Ota T, Isogai T, Tanaka T, et al. Identification and characterization of the potential promoter regions of 1031 kinds of human genes. Genome Res. 2001;11:677–684. - PMC - PubMed
    1. Maity SN, de Crombrugghe B. Role of the CCAAT-binding protein CBF/NF-Y in transcription. Trends Biochem. Sci. 1998;23:174–178. - PubMed
    1. Mantovani R. The molecular biology of the CCAAT-binding factor NF-Y. Gene. 1999;239:15–27. - PubMed
    1. McNabb DS, Xing Y, Guarente L. Cloning of yeast HAP5: a novel subunit of a heterotrimeric complex required for CCAAT binding. Genes Dev. 1995;9:47–58. - PubMed

Publication types

MeSH terms