A metabolomic perspective of melatonin metabolism in the mouse
- PMID: 18187545
- PMCID: PMC2276702
- DOI: 10.1210/en.2007-1412
A metabolomic perspective of melatonin metabolism in the mouse
Abstract
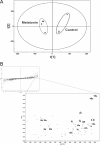
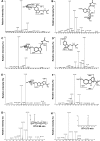
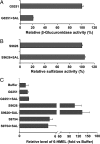
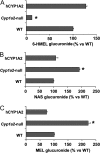
Metabolism of melatonin (MEL) in mouse was evaluated through a metabolomic analysis of urine samples from control and MEL-treated mice. Besides identifying seven known MEL metabolites (6-hydroxymelatonin glucuronide, 6-hydroxymelatonin sulfate, N-acetylserotonin glucuronide, N-acetylserotonin sulfate, 6-hydroxymelatonin, 2-oxomelatonin, 3-hydroxymelatonin), principal components analysis of urinary metabolomes also uncovered seven new MEL metabolites, including MEL glucuronide, cyclic MEL, cyclic N-acetylserotonin glucuronide, cyclic 6-hydroxymelatonin; 5-hydroxyindole-3-acetaldehyde, di-hydroxymelatonin and its glucuronide conjugate. However, N(1)-acetyl-N(2)-formyl-5-methoxy-kynuramine and N(1)-acetyl-5-methoxy-kynuramine, known as MEL antioxidant products, were not detected in mouse urine. Metabolite profiling of MEL further indicated that 6-hydroxymelatonin glucuronide was the most abundant MEL metabolite in mouse urine, which comprised 75, 65, and 88% of the total MEL metabolites in CBA, C57/BL6, and 129Sv mice, respectively. Chemical identity of 6-hydroxymelatonin glucuronide was confirmed by deconjugation reactions using beta-glucuronidase and sulfatase. Compared with wild-type and CYP1A2-humanized mice, Cyp1a2-null mice yielded much less 6-hydroxymelatonin glucuronide (approximately 10%) but more N-acetylserotonin glucuronide (approximately 195%) and MEL glucuronide (approximately 220%) in urine. In summary, MEL metabolism in mouse was recharacterized by using a metabolomic approach, and the MEL metabolic map was extended to include seven known and seven novel pathways. This study also confirmed that 6-hydroxymelatonin glucuronide was the major MEL metabolite in the mouse, and suggested that there was no interspecies difference between humans and mice with regard to CYP1A2-mediated metabolism of MEL, but a significant difference in phase II conjugation, yielding 6-hydroxymelatonin glucuronide in the mouse and 6-hydroxymelatonin sulfate in humans.
Figures


Similar articles
-
A novel enzyme-dependent melatonin metabolite in humans.J Pineal Res. 2013 Jan;54(1):100-6. doi: 10.1111/jpi.12003. J Pineal Res. 2013. PMID: 24446865
-
Predominance of 2-hydroxymelatonin over melatonin in plants.J Pineal Res. 2015 Nov;59(4):448-54. doi: 10.1111/jpi.12274. Epub 2015 Sep 15. J Pineal Res. 2015. PMID: 26331804
-
Development and Validation of an LC-MS/MS-Based Method for Quantifying Urinary Endogenous 6-Hydroxymelatonin.Chem Pharm Bull (Tokyo). 2022;70(5):375-382. doi: 10.1248/cpb.c21-00982. Chem Pharm Bull (Tokyo). 2022. PMID: 35491194
-
One molecule, many derivatives: a never-ending interaction of melatonin with reactive oxygen and nitrogen species?J Pineal Res. 2007 Jan;42(1):28-42. doi: 10.1111/j.1600-079X.2006.00407.x. J Pineal Res. 2007. PMID: 17198536 Review.
-
Melatonin metabolism, signaling and possible roles in plants.Plant J. 2021 Jan;105(2):376-391. doi: 10.1111/tpj.14915. Epub 2020 Aug 2. Plant J. 2021. PMID: 32645752 Review.
Cited by
-
Parallel pathways for serotonin biosynthesis and metabolism in C. elegans.Nat Chem Biol. 2023 Feb;19(2):141-150. doi: 10.1038/s41589-022-01148-7. Epub 2022 Oct 10. Nat Chem Biol. 2023. PMID: 36216995 Free PMC article.
-
Sleep and circadian abnormalities in patients with cirrhosis: features of delayed sleep phase syndrome?Metab Brain Dis. 2009 Sep;24(3):427-39. doi: 10.1007/s11011-009-9146-5. Metab Brain Dis. 2009. PMID: 19756996
-
Difference in desipramine metabolic profile between wild-type and CYP2D6-humanized mice.Drug Metab Lett. 2009 Dec;3(4):234-41. doi: 10.2174/187231209790218118. Drug Metab Lett. 2009. PMID: 19995332 Free PMC article.
-
Humanized transgenic mouse models for drug metabolism and pharmacokinetic research.Curr Drug Metab. 2011 Dec;12(10):997-1006. doi: 10.2174/138920011798062265. Curr Drug Metab. 2011. PMID: 22023319 Free PMC article.
-
N-acetyl serotonin derivatives as potent neuroprotectants for retinas.Proc Natl Acad Sci U S A. 2012 Feb 28;109(9):3540-5. doi: 10.1073/pnas.1119201109. Epub 2012 Feb 13. Proc Natl Acad Sci U S A. 2012. PMID: 22331903 Free PMC article.
References
-
- Leone RM, Silman RE 1984 Melatonin can be differentially metabolized in the rat to produce N-acetylserotonin in addition to 6-hydroxy-melatonin. Endocrinology 114:1825–1832 - PubMed
-
- Young IM, Leone RM, Francis P, Stovell P, Silman RE 1985 Melatonin is metabolized to N-acetyl serotonin and 6-hydroxymelatonin in man. J Clin Endocrinol Metab 60:114–119 - PubMed
-
- Kopin IJ, Pare CM, Axelrod J, Weissbach H 1960 6-Hydroxylation, the major metabolic pathway for melatonin. Biochim Biophys Acta 40:377–378 - PubMed
-
- Kopin IJ, Pare CM, Axelrod J, Weissbach H 1961 The fate of melatonin in animals. J Biol Chem 236:3072–3075 - PubMed
-
- Francis PL, Leone AM, Young IM, Stovell P, Silman RE 1987 Gas chromatographic-mass spectrometric assay for 6-hydroxymelatonin sulfate and 6-hydroxymelatonin glucuronide in urine. Clin Chem 33:453–457 - PubMed
Publication types
MeSH terms
Substances
Grants and funding
LinkOut - more resources
Full Text Sources
Other Literature Sources

